
Spectral Clustering: Uncovering the Hidden Social Fabric of Student Performance
Finding Patterns of Students' Behavior in Synthetic Social Networks
This paper implements Spectral Clustering on synthetic social networks derived from LMS Moodle logs to identify students' behavioral patterns. By mapping student activities (resources, quizzes, forums) into a similarity-based graph, the authors demonstrate that clusters of behavioral similarity correlate significantly with academic performance.
TL;DR
Can we predict a student's grade simply by looking at who they "act" like online? This paper explores the intersection of Educational Data Mining (EDM) and Spectral Graph Theory. By applying spectral clustering to Moodle interaction logs, the researchers found that behavioral similarity is a powerful proxy for academic success, showing over a 60% correlation between cluster membership and final grades.
Background: Beyond Traditional Clustering
In the realm of eLearning (LMS), student data is messy, high-dimensional, and rarely linear. While traditional algorithms like K-means are the "go-to" for many, they often fail to capture the underlying structure of social interactions. The authors pivot to Spectral Clustering, a method that uses the eigenvalues of a similarity matrix to perform dimensionality reduction before clustering. This allows the model to identify "communities" of behavior that are invisible to Euclidean distance-based methods.
The Motivation: From Logs to Logic
The researchers were driven by a simple intuition: Birds of a feather study together. If two students consume resources, take quizzes, and participate in forums at similar frequencies and sequences, do they end up with the same grade? To answer this, they transformed raw event logs into a Synthetic Social Network where edges represent behavioral similarity rather than explicit "friendships."
Methodology: The Power of the Fiedler Vector
The core technique relies on the Graph Laplacian (). The "magic" happens with the Fiedler Vector—the eigenvector corresponding to the second smallest eigenvalue. This vector provides a semi-optimal cut for the graph, effectively splitting students into groups based on their connectivity.
The Experimental Framework
- Activity Sequence: Events were grouped into 30-minute "sessions."
- Similarity Matrix: Cosine similarity was calculated between students based on these activity sessions.
- Graph Construction: A threshold of 0.5 was set to create edges in the network.
- Spectral Partitioning: The Fiedler vector was used to recursively divide the student body into behavioral clusters.
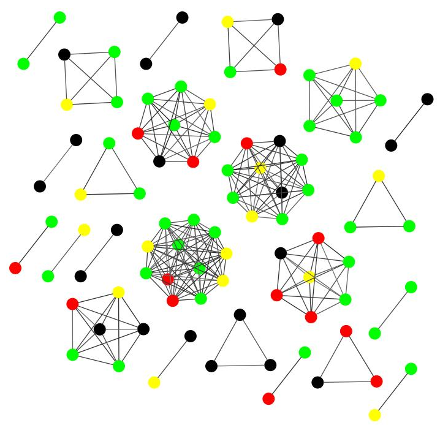 Fig 1: Clusters of resource usage in Microeconomics. Node colors represent grades (Yellow=A, Green=B, Red=C, Black=F).
Experiments & Results: Does Similarity Imply Success?
The study analyzed three major courses: Microeconomics, Quantitative Methods, and Corporate Economics.
Key Findings:
- The 60% Rule: In most cases, if you shared a cluster with a group of students, your grade was at least 60% likely to match the majority of that group.
- High-Performers Cluster Together: Students with grades A and B appeared in distinct clusters, particularly when analyzing quizzes and resources.
- The Forum Paradox: Interestingly, the "Forums" activity was less discriminative for high grades. In the largest forum components, high and low performers behaved similarly, suggesting that "participation" does not always equate to "mastery."
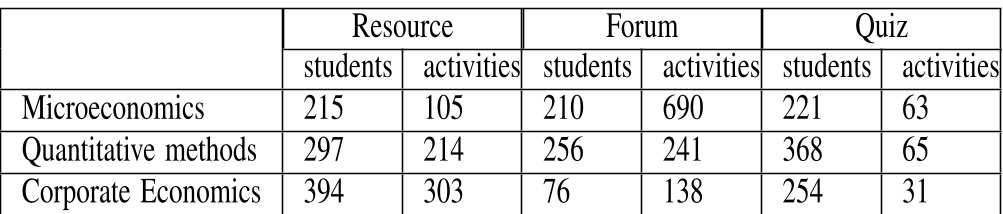 Table 1: Distribution of students and activities across the studied courses.
Centrality vs. Reality
The authors also tested Social Network Analysis (SNA) metrics like Degree Centrality and Closeness Centrality. Surprisingly, being "central" in the discussion forum didn't always lead to better grades. Some central nodes were top students, while others were those struggling with "educational difficulties," likely seeking help.
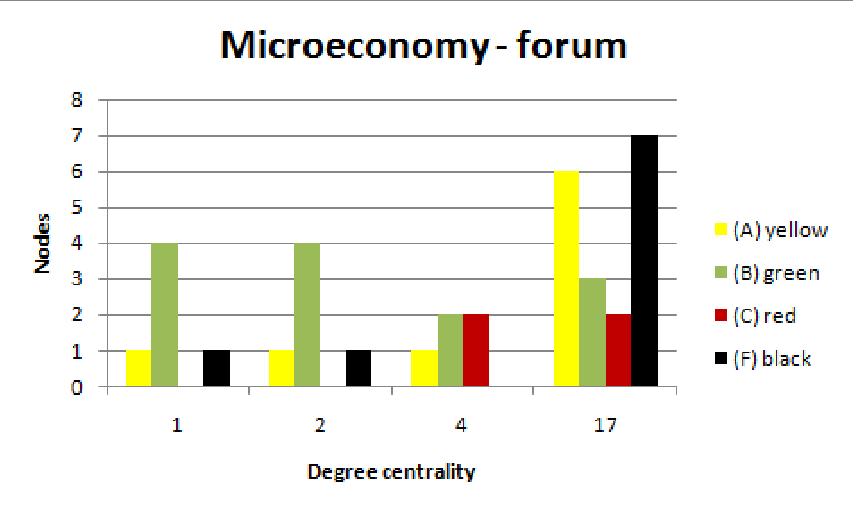 Fig 2: Degree centrality in the Microeconomics forum showing active participation from both ends of the grade spectrum.
Critical Analysis & Conclusion
Takeaway: This research proves that Spectral Clustering is a viable tool for Educational Data Mining. It effectively maps behavioral patterns to academic outcomes with high consistency.
Limitations:
- Data Scale: The dataset was relatively small, which might limit the generalizability of the spectral gaps.
- Uniform Weighting: The study treated all events (viewing a blog vs. taking a quiz) with equal importance. Real-world behavior suggests that certain actions are much heavier "predictors" of success than others.
Future Outlook: The next step in this evolution is likely Weighted Spectral Clustering or Temporal Graph Networks, where the order and importance of activities are factored into the similarity matrix. This would allow educators to create real-time "early warning systems" for students whose behavioral trajectory matches that of historical "at-risk" clusters.