
Fine-Grained PM2.5 Inference: Turning Crowdsourced Images into Air Quality Sensors
Fine-Grained Infer P M 2.5 Using Images from Crowdsourcing
This paper proposes a fine-grained PM2.5 concentration inference framework using crowdsourced images and sensor data. By leveraging an integrated Radial Basis Function (RBF) kernel-based ridge regression model, the system estimates air quality levels from mobile device data, achieving an R-squared value of 0.7484.
TL;DR
Air pollution, specifically PM2.5, is a silent killer, yet official monitoring stations are too sparse to provide hyper-local data. This paper introduces a framework that uses crowdsourced smartphone images and metadata (GPS, Time, Attitude) to infer PM2.5 concentrations. By applying a specialized RBF Kernel-based Ridge Regression on extracted haze features, the authors demonstrate that your morning commute photos could help map urban air quality with impressive accuracy.
Problem & Motivation: The Gap in the Grid
Fixing a city-wide air quality problem starts with measurement. While professional fixed stations are highly accurate, their multi-million dollar costs result in low spatial resolution. You might be breathing much worse air three blocks away from the nearest station without knowing it.
Previous attempts to fill this gap used satellite imagery or complex physical dispersion models. However, satellites lack "ground-level" precision, and physical models are too rigid for complex urban "canyons." The author’s insight is simple: Fine particles scatter light. When air is polluted, images become darker and edges become blurrier. Since everyone carries a camera (smartphone), why not use the crowd?
Methodology: From Pixels to Pollutants
1. The Physics of Haze
The paper utilizes a classic computer vision model for light attenuation: In this model, the "transmission" (trans) is directly affected by PM2.5. To capture this, they extract two core features:
- Undersample Directly (): Measures the minimum intensity across color channels to detect how much the scene's brilliance is "washed out" by haze.
- Image Convolution (): Uses a Laplacian operator to measure edge sharpness. Higher PM2.5 makes images blurrier, reducing the high-frequency components detected by the operator.
2. Framework Architecture
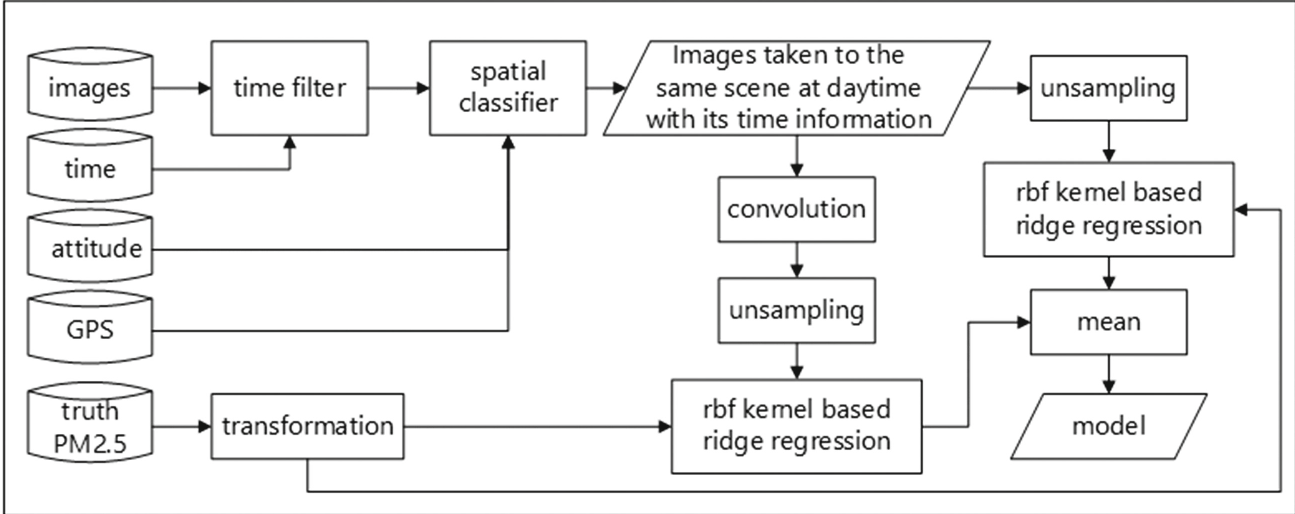 Figure 1: The proposed crowdsourcing and inference pipeline.
The system doesn't just look at pixels. It filters night shots, classifies locations using GPS, and performs Image Registration (using SURF features) to ensure that photos of the same scene are aligned before analysis.
3. The Relational Model
Because PM2.5 concentrations usually follow a skewed distribution (many low values, few extremes), the authors use a logarithmic transformation () to normalize the data. They then employ an Integrated RBF Kernel Ridge Regression, which combines the predictions from the color features () and texture features () to provide a robust final estimate.
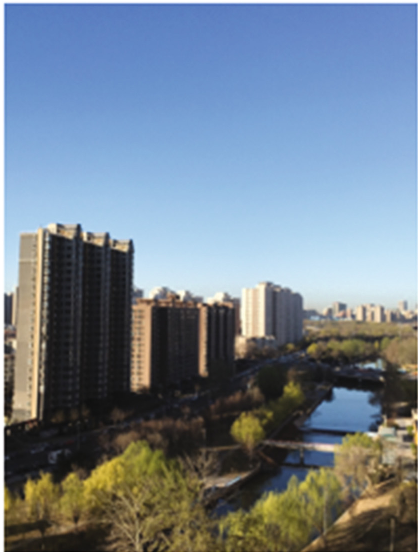 Figure 2: Preprocessing step ensuring consistency via SURF-based image registration.
Experiments & Results
The model was validated using a real-world dataset collected over 17 months in Beijing. The ground truth was provided by the Olympic Sports Center monitoring station.
- Scaling Performance: As the number of training samples increased, the model's error significantly dropped.
- Quantitative Success: At 320 training samples, the model achieved a Median MAE of 19.07 and an of 0.7484.
- Temporal Tracking: The model successfully tracked real-world PM2.5 fluctuations, proving it can distinguish between "clear" and "unhealthy" days based solely on image metadata.
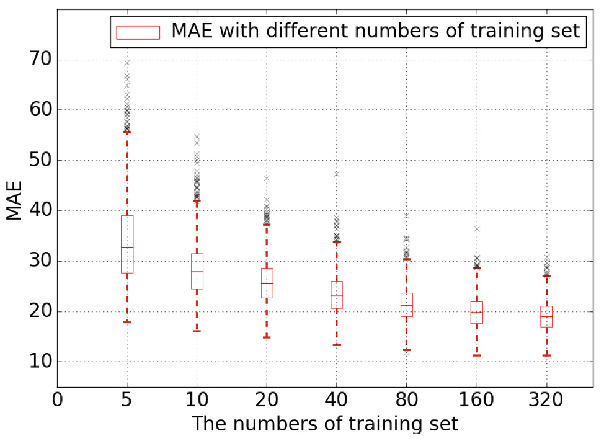 Figure 3: Box plots showing MAE and R-Squared values vs. training set size.
Critical Analysis & Conclusion
Takeaway
This paper proves that fine-grained air quality monitoring is possible without expensive sensors. By treating smartphone photos as physical probes for light scattering, urban planners can potentially generate high-resolution pollution heatmaps at zero hardware cost.
Limitations
- Hardware Variance: Different phone sensors (iPhone vs. Android) have different ISP (Image Signal Processor) tunings, which might "artificiality" sharpen or brighten images, potentially confusing the regression model.
- Scene Content: The model assumes the blurring is caused by PM2.5, but a dirty lens or a moving subject could also produce "haze-like" features.
Future Work
The next step for this research is to handle heterogeneous sensor data—normalizing the inputs from a thousand different camera types to ensure that a photo taken on an old phone yields the same PM2.5 result as a high-end flagship.