
Fine-Scale Soil Nutrient Mapping: Moving from Rigid Grids to Intelligent Geo-Parcels
Fine mapping of key soil nutrient content using high resolution remote sensing image to support precision agriculture in Northwest China
This paper introduces a parcel-based Digital Soil Mapping (DSM) framework targeting precision agriculture in Northwest China. By utilizing GF-2 high-resolution imagery and Deep Learning (RCF network), the study maps key soil nutrients (SOC, TN, P, K) at the geo-parcel scale rather than traditional grids, achieving superior spatial consistency and operational efficiency.
TL;DR
To support precision agriculture (PA) in Northwest China, researchers have developed a novel Digital Soil Mapping (DSM) framework that replaces traditional rectangular grids with automatically extracted land parcels. Using high-resolution GF-2 satellite imagery and the Richer Convolutional Features (RCF) deep learning network, the method aligns soil nutrient data (SOC, TN, P, K) with real-world field boundaries, reducing noise and improving computational efficiency for agricultural decision-making.
The "Salt and Pepper" Problem in Digital Soil Mapping
For decades, Digital Soil Mapping has been dominated by the raster (grid) paradigm. While easy to compute, it suffers from a fundamental flaw: geographic mismatch. A 20-meter grid often straddles the boundary between a fertilized orchard and a fallow field, leading to "mixed pixels" and inaccurate predictions.
Furthermore, grid-based mapping produces an enormous volume of data points. In this study's test site (Zhongning County), a standard grid approach generates over 173,000 units, many of which are redundant. This creates a "computational tax" on machine learning models without necessarily improving the granularity needed by farmers.
Methodology: The Parcel-Based Architecture
The authors' core insight is that soil management happens at the parcel level, not the pixel level. Their workflow consists of three sophisticated technical layers:
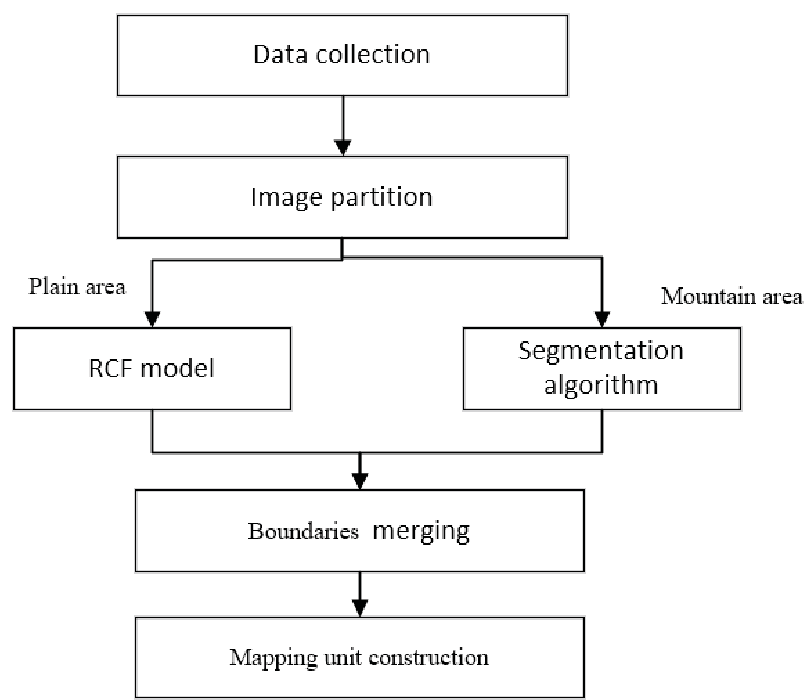
1. Intelligent Parcel Extraction
The team utilized GF-2 imagery (sub-meter resolution) to identify the "DNA" of the landscape. They applied:
- For Plains: The RCF (Richer Convolutional Features) network, a deep learning model designed to extract complex edges, identifying field boundaries with surgical precision.
- For Mountains: A three-level architecture to handle the irregular topography and constrained land cover found in mountainous agriculture.
2. Multi-Scale Data Fusion
Environmental variables—ranging from ASTER DEM-derived topography to regional climate data—exist at different scales. The researchers implemented a scale-transformation process to "aggregate" these variables into the newly defined parcels, ensuring that each mapping unit contained a statistically representative environmental signature.
3. Random Forest (RF) Inference
A Random Forest model was trained on field samples to predict soil organic carbon (SOC), total nitrogen (TN), available phosphorus (P), and available potassium (K).
Experimental Results: Precision and Efficiency
The experiment in Zhongning County revealed that the parcel-based method is not just a stylistic change—it’s a functional upgrade.
- Unit Reduction: The parcel method used ~25% fewer prediction units than a 20m grid, significantly speeding up model inference.
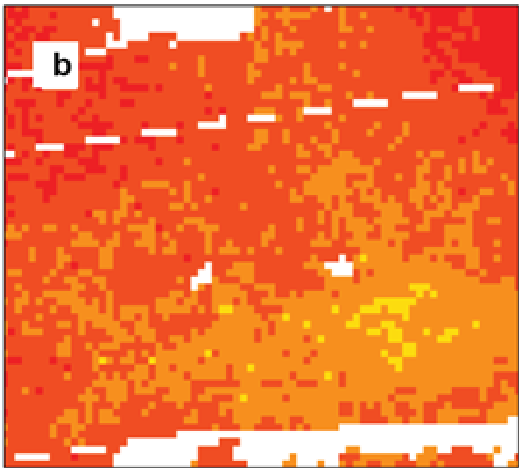
- Noise Elimination: As shown in the comparison below, grid-based maps (b) suffer from "salt and pepper" noise—erratic pixel variations that don't exist in nature—whereas parcel-based maps (a) provide clean, manageable boundaries.
- Accuracy Stability: The RMSE and R² values remained comparable to grid-based methods (e.g., TN reaching an R² of 0.46), proving that grouping pixels into parcels does not lead to a loss of critical information.
Critical Insight: Why This Matters for the Future
This research highlights a shift toward Object-Based Machine Learning in geosciences. By treating a "field" as a single entity rather than a collection of independent pixels, we introduce an inductive bias into our models that reflects human management of the earth.
The sensitivity analysis also provided a key environmental takeaway: the Yellow River remains the dominant factor in soil formation in this region, with soil water dynamics (aridity and moist indexes) playing a secondary but vital role in nutrient distribution.
Conclusion & Limitations
While the method excels in visual clarity and computational efficiency, the authors acknowledge that parcel extraction is challenging. If the initial deep learning model fails to identify a boundary correctly, the soil prediction for that entire unit may be skewed. Future work will look toward 3D soil property prediction, adding a vertical dimension to this horizontal precision.
This study serves as a blueprint for the next generation of precision agriculture systems, where satellite "eyes" and AI "brains" work together to treat every land parcel exactly as it deserves.