
Flickr: Who is Looking? Decoding the Social Pulse of Digital Photography
Flickr: Who is Looking?
This paper presents a multi-dimensional characterization of user behavior on Flickr, analyzing 1.83 million photos over 50 days. It identifies that photo popularity follows a power law and is predominantly driven by social factors, including contact networks and group pooling.
TL;DR
This seminal study delves into the "receiving end" of social media, moving beyond how we tag photos to how we consume them. By mining Flickr's server logs, the research reveals that digital attention is a highly skewed, socially-driven phenomenon where 50% of a photo's lifetime views typically occur in the first two days, powered largely by the uploader's social circle and group affiliations.
Background: Beyond the Upload
In the mid-2000s, Flickr was the epicenter of the social web. While previous research agonized over why users tag (social incentives, retrieval, or attention-seeking), this paper asks a more fundamental question: "Who is looking?" Understanding the "Receiver" is critical for infrastructure—if we know how and when people look, we can build better caches, smarter ranking algorithms, and more efficient networks.
The Problem: The Mystery of Discovery
The digital world is a "Long Tail" environment, but how content moves from the tail to the head was poorly understood. Prior work suggested social browsing was important, but lacked the longitudinal data to prove how fast it happened or how far (geographically) that interest reached.
Methodology: High-Resolution Log Mining
The author tracked 1.83 million photos over 50 days. Unlike studies that use API scraping—which can be limited—this research used server access logs to identify "explicit interest." A view was only counted when a user clicked a thumbnail to see the full photo, filtering out passive browsing.
They analyzed three specific dimensions:
- Temporal: The decay of interest over 50 days.
- Social: The correlation between views and the owner's "contacts" or "group pools."
- Spatial: Using IP-to-Geo mapping to see if popular photos travel further than niche ones.
Core Insights: The "Social Backbone"
1. The Power Law of Attention
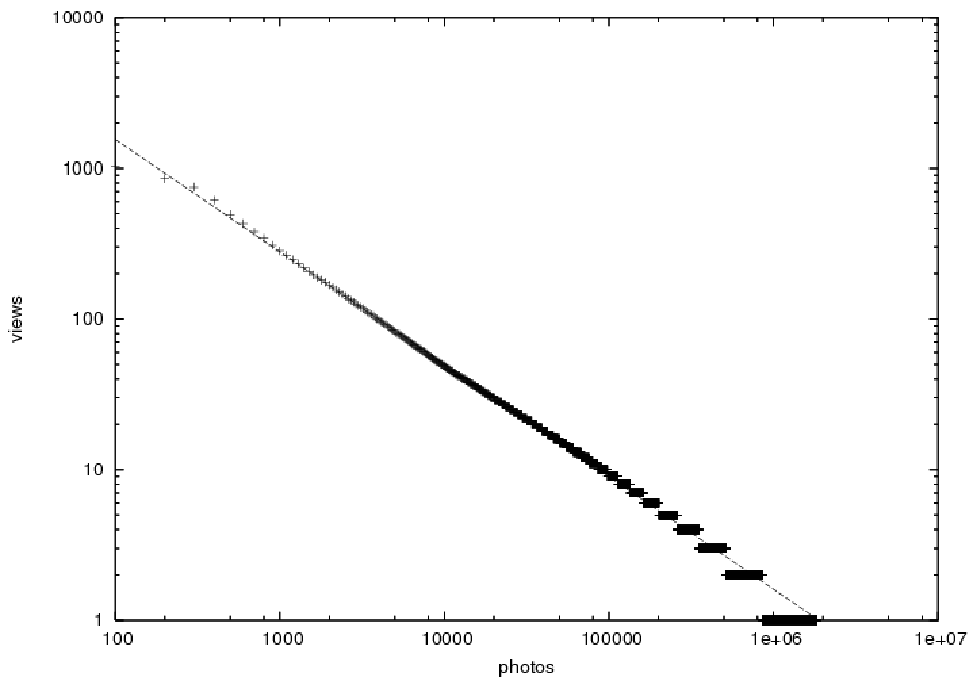
The distribution of views is extremely skewed. As seen in Figure 1, the probability follows a power law. A tiny elite of active users and spectacular "viral" photos command the majority of the community's attention, while most photos receive fewer than 8 views.
2. The 48-Hour Peak
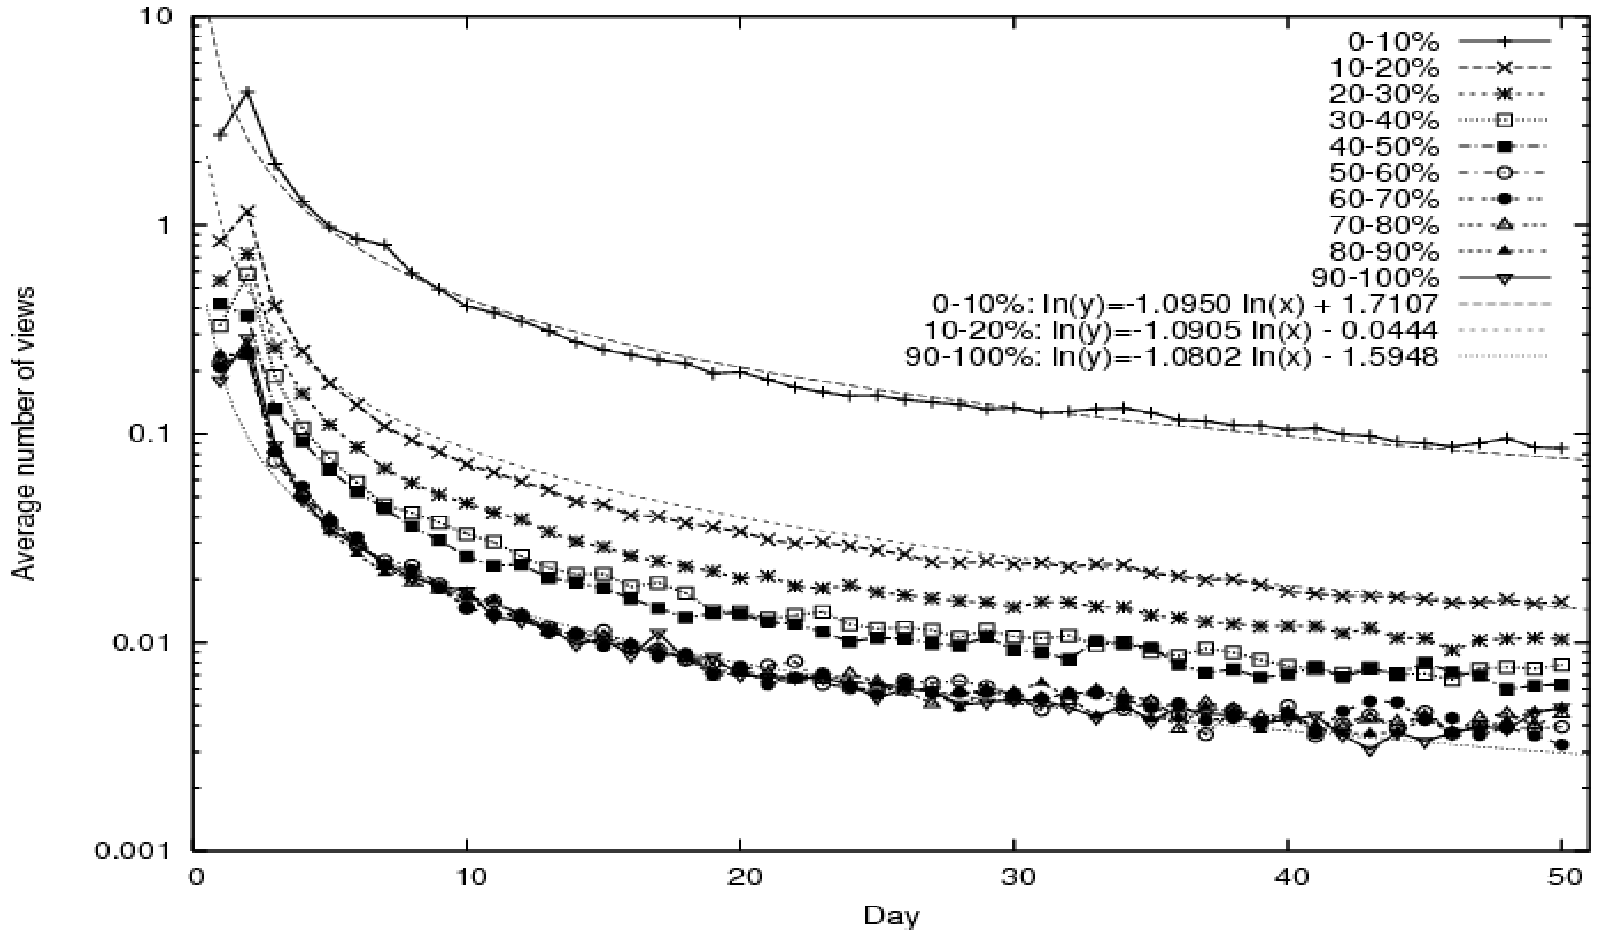
The study found a consistent "Discovery" pattern. Users don't stumble upon photos weeks later; they find them instantly.
- 65% of popular photos are discovered within the first 3 hours.
- Viewership peaks within the first 48 hours and then follows an exponential decay ().
3. Social Metrics as Predictors
What makes a photo popular? The answer isn't just the "quality" of the image, but the Social Backbone.
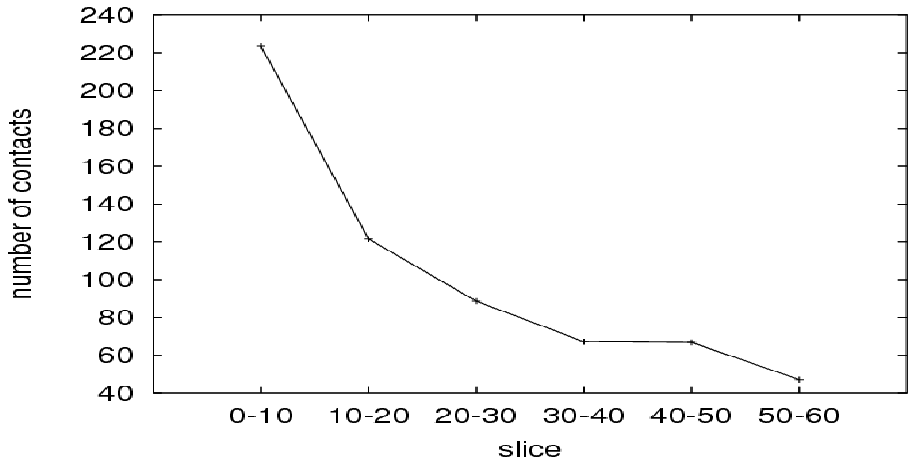
- Contacts: There is a direct, sharp correlation between the number of people following an owner and the views a photo gets.
- Group Pools: Photos in multiple "Pools" (themed communities) survive longer and reach people outside the owner’s immediate contact list, explaining the "late discovery" of certain images.
4. Geography: Popularity Goes Global
The paper confirms a fascinating spatial hypothesis: Niche photos are local; popular photos are global. Using standard deviations of longitude and latitude, the author showed that photos with high view counts have a significantly larger geographic spread. In contrast, "low-view" photos are mostly viewed by people in the same geographic region as the uploader—likely real-world friends and family.
Critical Analysis & Conclusion
This paper provides a rigorous mathematical foundation for what we now call "Virality."
Takeaways for Industry:
- Caching Strategy: Since 50% of views happen in 48 hours, CDNs should prioritize "warm" social content based on the uploader's contact count.
- Ranking: Social affiliation is a better early-stage predictor of success than content analysis.
Limitations: The study does not account for the content of the photo (e.g., aesthetics, objects). It treats every view as a data point, but does not explore the "Interest" level of the viewer or their relationship to the owner in a qualitative sense.
Future Outlook: As we move into an era of algorithmic feeds (like TikTok), the "Social Backbone" identified here is being supplemented by "Interest Graphs." However, the temporal decay and the geographic spreading principles established in this 2007 study remain the bedrock of social media engineering.