
Beyond Loss: Scaling Laws for Reasoning via Expert Trajectory Proxies
Forecasting Downstream Performance of LLMs With Proxy Metrics
The paper introduces "Proxy Metrics," a framework for forecasting LLM downstream performance by aggregating token-level statistics (e.g., entropy, top-k accuracy, rank) from a model's predictive distribution over expert reasoning trajectories. Using this method, the authors achieve SOTA results in model selection (Mean Spearman ρ = 0.81) and pretraining data ranking while reducing compute costs by up to 10,000x compared to direct evaluation.
TL;DR
Predicting how a model will perform on complex reasoning tasks (like AIME or GPQA) is notoriously difficult when the model is still small or early in training. This paper introduces a library of proxy metrics—scalar values derived from a model's "alignment" with expert solutions—that can predict downstream performance with 10,000x less compute than current methods and 2x the accuracy of loss-based scaling laws.
The "Blind Spot" of Cross-Entropy
In the race to build frontier LLMs, researchers face a dilemma:
- Pretraining Loss is easy to measure but task-agnostic. Two models with the same loss can have wildly different reasoning capabilities.
- Benchmark Accuracy is what we care about, but it's "all-or-nothing." A small model might get 0% on a hard math test, giving the developer zero signal on whether they are heading in the right direction.
The authors identify a crucial insight: A model that cannot yet solve a task may still "recognize" the correct path. By looking at how a model reacts to each token in an expert reasoning chain, we can extract a dense signal long before the model can generate that chain itself.
Methodology: The 80-Dimensional "Pulse" of a Model
Instead of just checking if the model gets the right answer, the authors pass expert solutions through the candidate model and look at its next-token probability distribution.
1. The Core Metrics
They calculate 10 statistics at every token, including:
- Top-k Accuracy: Is the expert's token in the model's top 1/3/5 guesses?
- Margin: the gap between the model's top guess and the expert's token.
- Wrong-Confidence: How much probability does the model waste on incorrect tokens?
2. Smart Weighting (The Secret Sauce)
Not all tokens are equal. Predicting "the" in a sentence is easy. Predicting a specific variable in a Python script is hard. The researchers use 8 weighting schemes to filter the noise:
- Inverse Frequency: Give more weight to rare tokens (key technical terms).
- Expert-Disagreement: Focus on steps where the model is currently most confused.
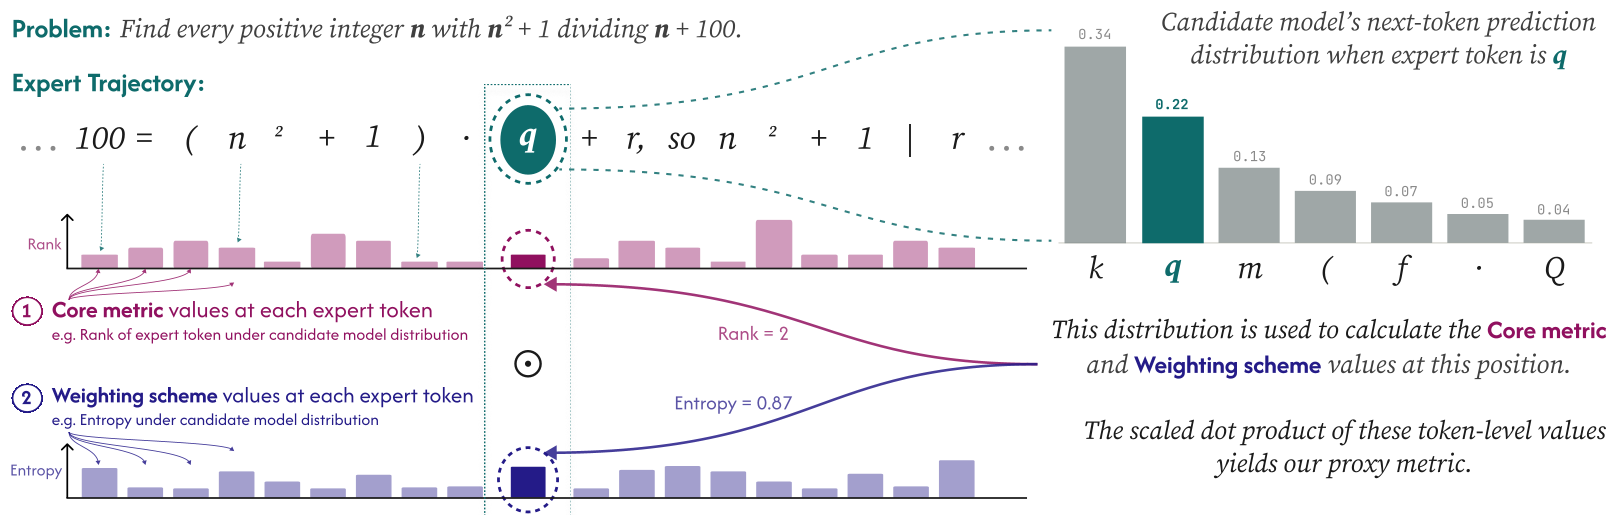 Figure: The method transforms a single forward pass over expert text into a rich vector of performance indicators.
Experimental Breakthroughs
Cross-Family Ranking
When testing 18 different models (from Llama-3 to Qwen-3), traditional cross-entropy loss failed to rank them correctly (ρ = 0.36). However, a simple linear ranker using these proxy metrics achieved a correlation of 0.81. It effectively predicts which model is "smarter" without ever running an expensive benchmark.
The 10,000x Speedup in Data Selection
On the DataDecide testbed, the authors had to rank 25 different pretraining corpora. Their proxy metrics allowed 4M-parameter models to accurately predict the ranking of 1B-parameter models. This allows teams to decide which data to use at 0.01% of the total budget.
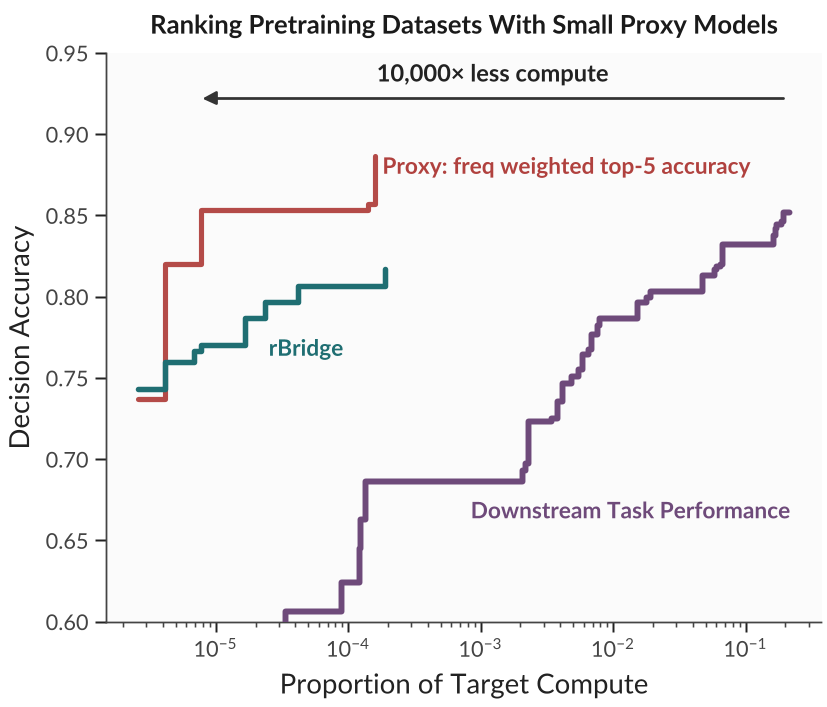 Figure: The Pareto frontier shift. Proxy metrics (stars) provide high decision accuracy at a fraction of the compute required by direct evaluation.
Predicting the Future: Training-Time Extrapolation
Perhaps the most impressive result is the ability to "see around the corner" during a training run. By fitting a power law to these proxy metrics at the 80k step mark, the authors could predict the final performance at 1.4M steps (an 18x horizon).
| Task | Proxy RMSE | CE Loss RMSE | Compute RMSE |
|---|---|---|---|
| Mean Extrapolation Error | 0.024 | 0.059 | 0.055 |
The proxy-based forecasts were 2x more accurate than using standard validation loss or compute-based scaling laws.
Critical Analysis & Takeaways
The core value of this work is grounding evaluation in the reasoning process rather than the outcome.
- Why it works: Reasoning is a sequence of "forking tokens." By measuring a model's competence at these specific junctions—rather than its ability to finish the whole marathon—we get a smoother, more predictive capability curve.
- Limitations: The method requires "Expert Trajectories." While we have these for math and code, it might be harder to find "gold standard" traces for creative writing or open-ended chat.
- Future Impact: This could revolutionize "Data Mixture" optimization. Instead of training 1B models to see if a dataset is good, we can use "micro-proxies" to iterate 100x faster.
Conclusion
This paper serves as a vital "Reality Check" (referencing Lourie et al., 2025) for scaling laws. It proves that while loss is smooth, it is too blunt an instrument for the reasoning era. By shifting our focus to token-level alignment with experts, we can make model development significantly more scientific and compute-efficient.