
Precision Energy Intelligence: Decoding University Power Consumption via Machine Learning
Forecasting power consumption for higher educational institutions based on machine learning
The paper presents a framework for high-granularity (15-minute interval) electric power consumption forecasting for university campuses using Artificial Neural Networks (ANN) and Support Vector Regression (SVR). By analyzing four distinct building clusters, the study demonstrates that incorporating university-specific operational data achieves an average error rate between 3.46% and 10%.
TL;DR
Managing a university's energy grid is a multifaceted challenge due to localized usage spikes and complex academic calendars. This study introduces a robust forecasting framework using ANN and SVR to predict 15-minute interval power loads. By integrating "Admin Work Hours" and "Class Schedules" into the feature set, the researchers achieved empirical error rates as low as 3.46%, providing a blueprint for more efficient micro-grid operations.
The Motivation: Why University Clusters are a "Hard" Problem
Most energy forecasting models treat buildings as isolated units or part of a homogeneous residential block. However, a university is a "city within a city" with distinct functional clusters:
- Academic Hubs: Subject to rigorous class schedules and semester cycles.
- Research Labs: High-intensity, equipment-driven loads with less periodicity.
- Dormitories: Residential patterns influenced by student lifestyle rather than office hours.
Current SOTA methods often lack the granularity (15-min intervals) required for immediate demand-side management in smart grids. The authors recognized that to bridge this gap, they needed to look beyond the thermometer and the clock, diving deep into the institutional pulse of the campus.
Methodology: Engineering the "Academic Rhythm"
The core innovation lies in the transformation of raw data into "Machine Learning-ready" insights. The researchers didn't just feed the model raw numbers; they reconstructed the feature space.
1. Handling the "Cylindrical" Nature of Time
Standard time formats (0-23 hours) create artificial discontinuities (e.g., 23:59 and 00:01 are numerically far but temporally close). The authors used trigonometric encoding to map time onto a 2D circle, preserving the logical proximity of consecutive time steps.
2. The Multi-Tiered Feature Strategy
The study tested three increasingly complex data models:
- M1: Baseline (Weather + Holidays + Basic Time).
- M2: Professional Layer (M1 + Administrative Work Hours).
- M3: Academic Layer (M2 + Class Schedules).
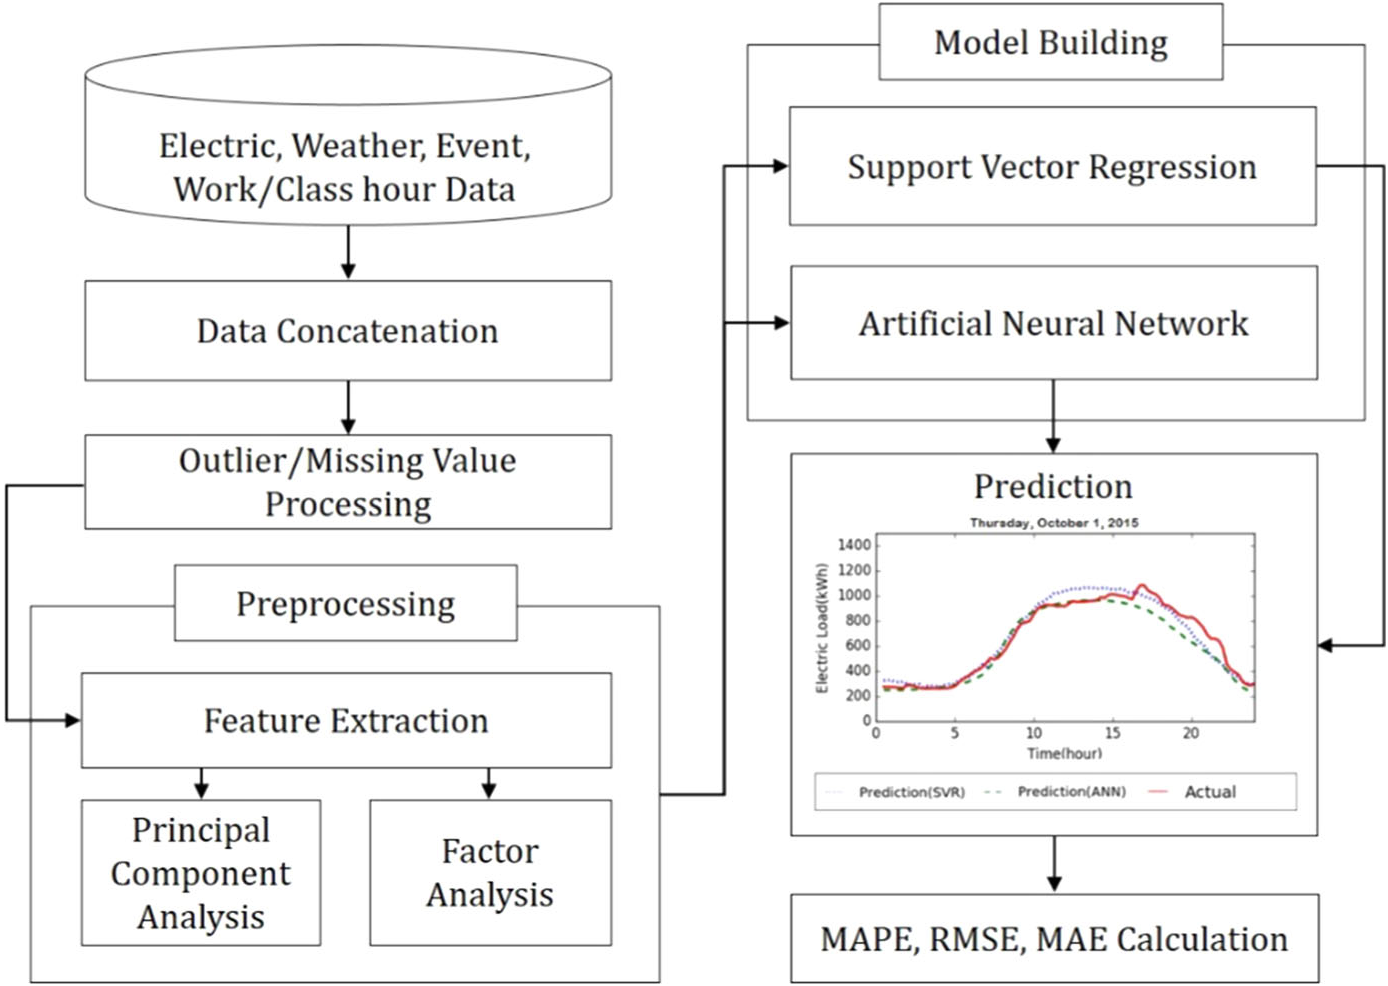 Figure 1: The overall workflow from data collection through Amelia-based outlier processing to final model evaluation.
Experiments: ANN vs. SVR
The researchers deployed two heavy hitters in the regression world: Artificial Neural Networks (ANN) and Support Vector Regression (SVR). To combat the "curse of dimensionality," they applied Principal Component Analysis (PCA).
Key Performance Findings:
- ANN dominated: The non-linear mapping capabilities of ANN (specifically Feed-Forward networks) proved superior in capturing the erratic nature of lab-heavy clusters.
- Feature Importance: For academic clusters (Clusters A & C), the inclusion of class schedules (M3) was the "secret sauce" that slashed error rates.
| Cluster | Best Model | MAPE (%) |
|---|---|---|
| Cluster A (Humanities) | ANN (M3) | 9.36 |
| Cluster B (Science) | SVR+PCA (M3) | 5.87 |
| Cluster C (Science) | ANN (M3) | 3.46 |
| Cluster D (Dormitory) | ANN+PCA (M1) | 9.75 |
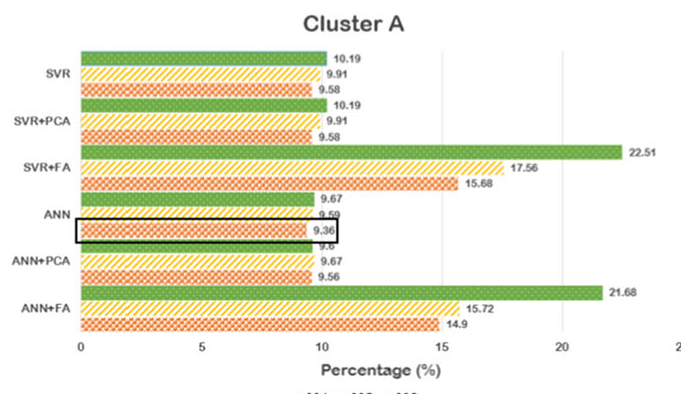 Figure 2: Performance metrics showing how ANN generally leads in accuracy across the various clusters.
Visualizing Success: Event Days vs. Normal Days
The models were remarkably resilient, accurately predicting loads even during "shock" events like entrance exams and graduation ceremonies. This proves that the model isn't just memorizing patterns; it is understanding the underlying operational logic of the institution.
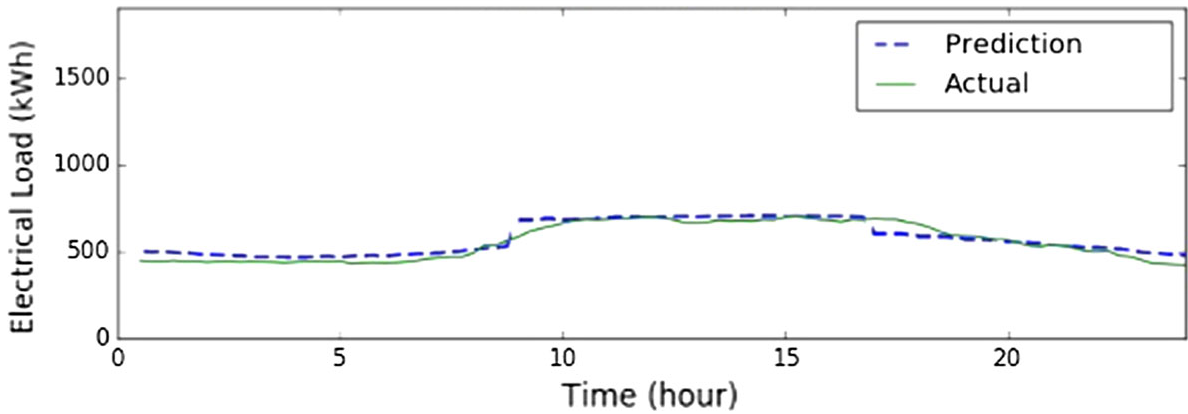 Figure 3: Predicted vs. Actual load for Cluster C, demonstrating high fidelity in the 15-minute interval forecasting.
Critical Analysis & Future Outlook
Limitations: While the results are impressive, the study relies on fixed administrative schedules. In a post-pandemic world where "hybrid" classes are common, real-time occupancy data (via Wi-Fi logs or IoT sensors) would likely be required to maintain these accuracy levels.
Final Takeaway: This research successfully transitions power forecasting from a "general statistical task" to a "domain-aware intelligence task." For facility managers, the message is clear: Your data is only as good as your understanding of what happens inside your buildings. Integrating institutional "meta-data" is no longer optional—it is the catalyst for SOTA performance.