
Beyond the Single Firm: Mapping Systemic IT Risk in the U.S. Capital Market
A Framework for Assessing Technology Risks in Transaction-Based Extended Enterprises: U.S. Capital Market Case
The paper proposes a novel risk assessment framework for monitoring Information Technology (IT) operational risk within complex, transaction-based "Extended Enterprises" (EEs), specifically targeting the U.S. capital market. It introduces the Technology Risk Index (TRI) and integrates Fault Tree Analysis (FTA) to quantify dependencies and identify systemic vulnerabilities across interconnected financial entities.
TL;DR
On July 8, 2015, a software update at a single data center paralyzed the New York Stock Exchange for four hours. This event highlighted a terrifying reality: our global financial infrastructure is a "System of Systems" where a minor glitch in one node can threaten the integrity of the whole. This paper introduces a rigorous framework to quantify this risk, moving from firm-level auditing to a holistic Extended Enterprise (EE) approach using Fault Tree Analysis (FTA) and a proprietary Technology Risk Index (TRI).
The Problem: The "Glitch" in the Machine
Current risk management frameworks like COSO or ISO focus on the "four walls" of an organization. However, the U.S. capital market operates as an Extended Enterprise—a loosely coupled value chain of suppliers (agent lenders), processors (utilities like DTCC), and customers (broker-dealers).
The authors argue that we are currently "flying blind" because:
- Interdependence is Unchecked: We measure the risk of Bank A and Bank B, but not the risk of the connection between them.
- Data is Underutilized: Regulations like the SEC's Systems Compliance and Integrity (SCI) generate incident reports, but there is no mathematical model to turn these reports into a predictive safety index.
Methodology: Engineering Financial Stability
The authors propose a structured four-step engineering approach to solve this:
1. Industry Segmentation
Rather than treating the "Capital Market" as a monolith, they segment it into functional EEs based on product groups (Equities vs. Fixed Income) and lifecycles (Primary, Secondary, Lending).
2. Structural Modeling
By creating data flow diagrams, the framework identifies critical path participants. For example, in the Equity Lending market, thousands of "Beneficial Owners" exist, but only a handful of "Custodian Banks" and "Utilities" (like the Fedwire) act as the backbone.
3. The Technology Risk Index (TRI)
Individual firms are assigned a TRI based on three types of metrics:
- Lagging (TPM1): Historical incident scores.
- Current (TPM2): Transaction disruption percentages.
- Leading (TPM3): Infrastructure stability (audit scores + planned changes).
4. Fault Tree Analysis (FTA) & Systemic Criticality
This is the core innovation. The authors use logic gates to represent the market's architecture:
- OR Gates: Represent single points of failure (e.g., if a unique Utility fails, the EE fails).
- AND Gates: Represent redundancy (e.g., if multiple interchangeable Broker-Dealers exist).
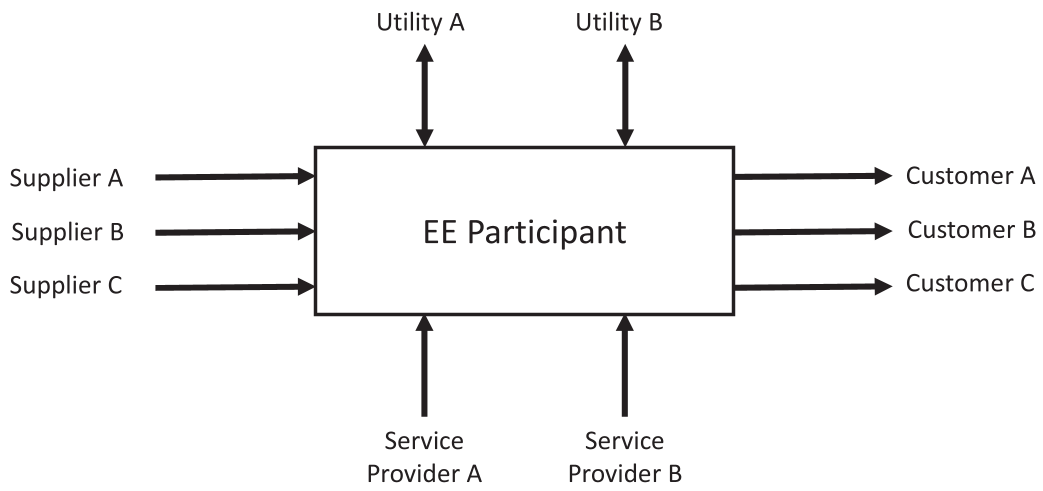 Above: A context diagram showing how participants, utilities, and service providers interact in a transaction-based EE.
Key Insights: Why "Risk Level" Isn't Enough
The most striking finding of the paper's illustration using the Equity Securities Lending market is the divergence between Risk and Criticality.
Using the Fussell–Vesely Importance (FV-I) method, the authors demonstrate that a firm with "At Target" risk (meaning they are very safe) can actually be the most dangerous point in the system if they have no redundant backups (an OR gate position).
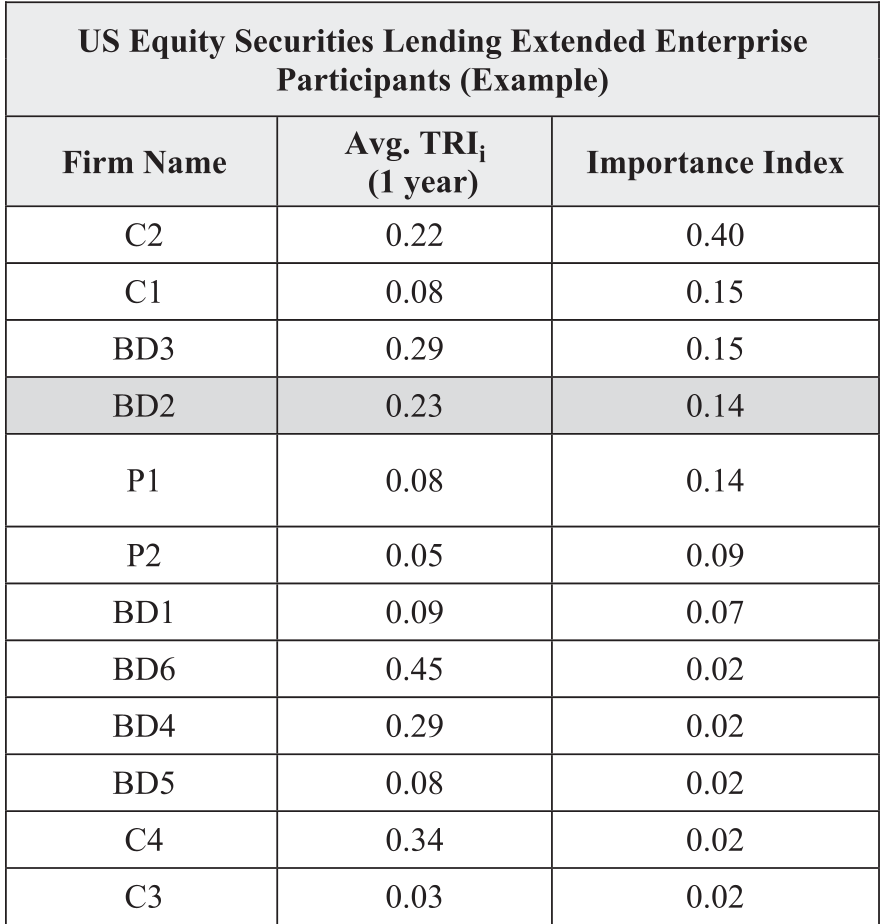 Above: Note how Custodian C1 has a low TRI (0.08) but high Importance (0.15), while Broker BD6 has a high TRI (0.45) but negligible Importance (0.02).
Critical Analysis & Conclusion
Takeaway
The paper successfully bridges the gap between Industrial Reliability Engineering and Financial Regulation. By treating the U.S. capital market as a "System of Systems," it provides regulators with a mathematical tool to decide where to send auditors and where to require higher capital buffers.
Limitations
- Data Transparency: The model relies on firms self-reporting "unflattering" data about IT glitches.
- Static vs. Dynamic: The fault tree is a snapshot. In modern markets, routing can change in milliseconds, requiring a more dynamic, perhaps AI-driven, graph model.
Future Outlook
As finance moves toward decentralized finance (DeFi) and cloud-native "as-a-service" models, this type of structural fault analysis will become mandatory for preventing the next "Flash Crash."