
Bridging the Resolution Gap: A Data Mining Strategy for Metropolitan Freight Planning
Freight Data Mining Strategy Using Socio-economic Variables for Metropolitan Planning
This paper presents a clusters-based freight data mining strategy to bridge the gap between coarse county-level and overly granular Traffic Analysis Zone (TAZ) levels of freight data. By utilizing the Ward’s hierarchical clustering method and socio-economic variables, the authors successfully aggregated 312 TAZs into 28 Freight Analysis Zones (FAZs) for the Mobile Metropolitan Area (MMA), achieving a high R-squared value of 0.85 in model performance.
Executive Summary
TL;DR: This paper introduces a sophisticated data mining strategy to solve the "resolution mismatch" in transportation planning. By applying clustering algorithms to socio-economic data, the researchers transformed 312 granular Traffic Analysis Zones (TAZs) into 28 cohesive Freight Analysis Zones (FAZs) for the Mobile Metropolitan Area. This method significantly outperforms traditional administrative partitioning, providing a data-driven foundation for infrastructure investment.
Positioning: This work serves as an essential methodological bridge in the transportation modeling pipeline, moving from raw national databases (FAF2.2) to actionable local planning tools through unsupervised learning.
The "Goldilocks" Problem in Freight Data
In the world of infrastructure planning, data resolution is everything. Planners face a dilemma:
- FAF2.2 Data: Covers the entire USA but uses only 114 zones. It's too "zoomed out."
- County Level: Aggregates everything into one bucket, hiding internal traffic hotspots.
- TAZs (Traffic Analysis Zones): Based on census blocks, these are often too small, with many having zero freight activity, creating "noise" in the model.
The authors argue that we need an intermediate level—Freight Analysis Zones (FAZs)—that are "just right" for metropolitan-level analysis.
Methodology: The Core Engine
The strategy relies on an iterative process of data reduction and grouping.
1. Feature Engineering (R-Analysis)
Out of 40 potential variables, the team identified 8 critical drivers for freight activity:
- Economic: Total employment (Retail, Service, Other), Median Household Income, and Number of Households.
- Spatial: Latitude, Longitude, and Zip Codes (to ensure geographical contiguity).
2. Constraint-Driven Clustering
Unlike naive clustering, the authors recognized that physical infrastructure (Interstates) defines movement. They segmented the Mobile Metropolitan Area (MMA) into 5 sectors bounded by I-10 and I-65 before performing any math.
3. Ward’s Hierarchical Clustering
The core algorithm uses Ward's Method, which minimizes the "loss of information" (Within-Cluster Sum of Squares) during the merging process. To determine the number of clusters, they used a bootstrap-based tree validation.
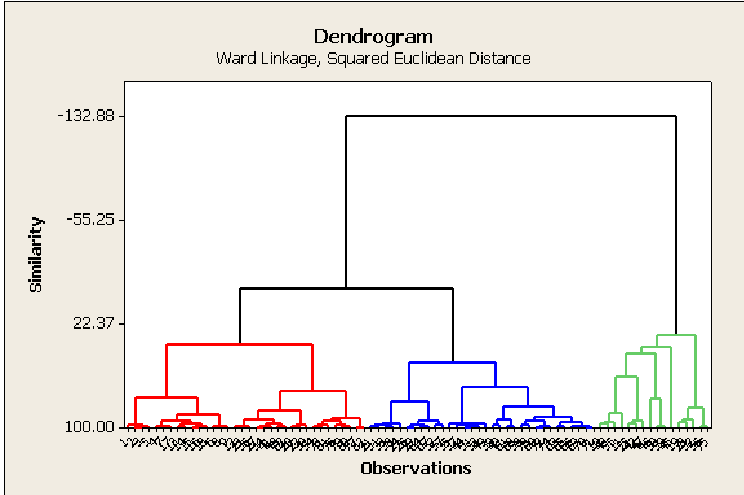 Figure: The tree structure used to determine the optimal FAZ count.
Experiments and Performance
The researchers compared several models (MHI, HH, District-based, etc.) against their proposed MHIE model (Median Household Income with Euclidean distance).
Key Metrics:
- R-Squared (RS): Measures the proportion of variability explained. The MHIE model reached 0.85, compared to just 0.67 for the existing MPO Districts.
- RMSSTD: A measure of cluster compactness. The lower the better. The proposed model achieved 0.93, a significant improvement over the 8-variable baseline (1.67).
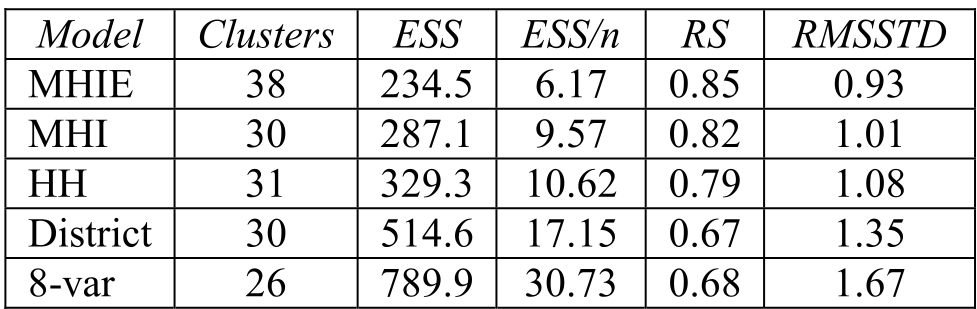 Table: Comparison of various clustering models shows HH and MHI variants providing superior separation.
Deep Insight: Beyond the Algorithm
The most impressive part of this work is the Subject Matter Expertise loop. The algorithm often produced "non-contiguous" zones (clusters that aren't physically touching).
To fix this, the team performed an Industrial Sector Analysis. If an isolated TAZ shared the same NAICS industrial profile (e.g., heavy manufacturing) as its neighbor, they were merged manually. This "Human-in-the-loop" approach ensures the technical output is functionally viable for road-building and zoning.
Conclusion & Takeaways
Summary: The result is a refined map of 28 FAZs that accurately reflects the economic and geographic pulse of Mobile, Alabama.
Limitations: The study relies heavily on the quality of proprietary socio-economic data. Furthermore, while it handles "static" variables well, it doesn't account for dynamic traffic fluctuations. Future Work: This methodology could be automated for other mid-sized US cities, allowing the Federal Highway Administration to provide "pre-clustered" disaggregated data to local MPOs, streamlining national infrastructure planning.
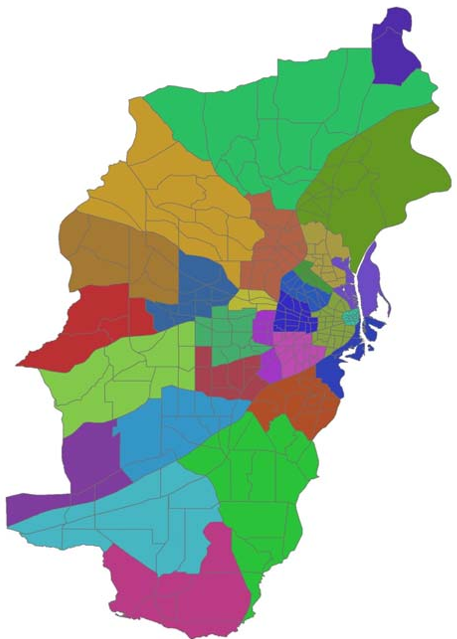 Figure: The final refined Freight Analysis Zones for the Mobile area.