
Mining the Kernel: Automated Discovery of Systemic Bottlenecks via Frequent Patterns
Frequent paern mining for kernel trace data
The paper introduces a novel framework for mining kernel trace data using Frequent Pattern Mining (specifically Maximal Frequent Itemset Mining) to detect systemic performance issues. By transforming time-series kernel events into parallel itemsets via "window folding" and "window slicing," the authors successfully isolated problematic inter-process communication patterns in Linux and Solaris systems.
TL;DR
Kernel tracing generates massive, opaque logs that are a nightmare for manual debugging. This paper proposes a framework that treats kernel events as "items" in a shopping basket. By using Maximal Frequent Itemset Mining (MFI) and a clever "Fold-and-Slice" windowing technique, the authors can automatically pinpoint malfunctioning processes and hidden inter-process communication bottlenecks that traditional tools like top completely miss.
Background: The Complexity Crisis in Kernel Tracing
Operating systems are non-deterministic. Between CPU scheduling, interrupts, and multi-threaded execution, the exact sequence of events in a kernel log is rarely identical, even when running the same workload.
Current state-of-the-art tools like LTT (Linux Trace Toolkit) and dTrace are excellent at collecting data but terrible at interpreting it. They typically provide simple aggregations (e.g., total syscall counts). If a process like a stock ticker applet (gtik) starts flooding the X Server with requests, a sysadmin might see high CPU usage but won't easily see why or which interaction is the culprit without writing complex, expert-level scripts.
Methodology: The Fold-and-Slice Insight
The core challenge is that OS scheduling introduces "jitter." If Process A calls a syscall and then Process B calls one, the log might show A, B or B, A depending on the millisecond-level timing. Traditional sequence mining would treat these as different patterns.
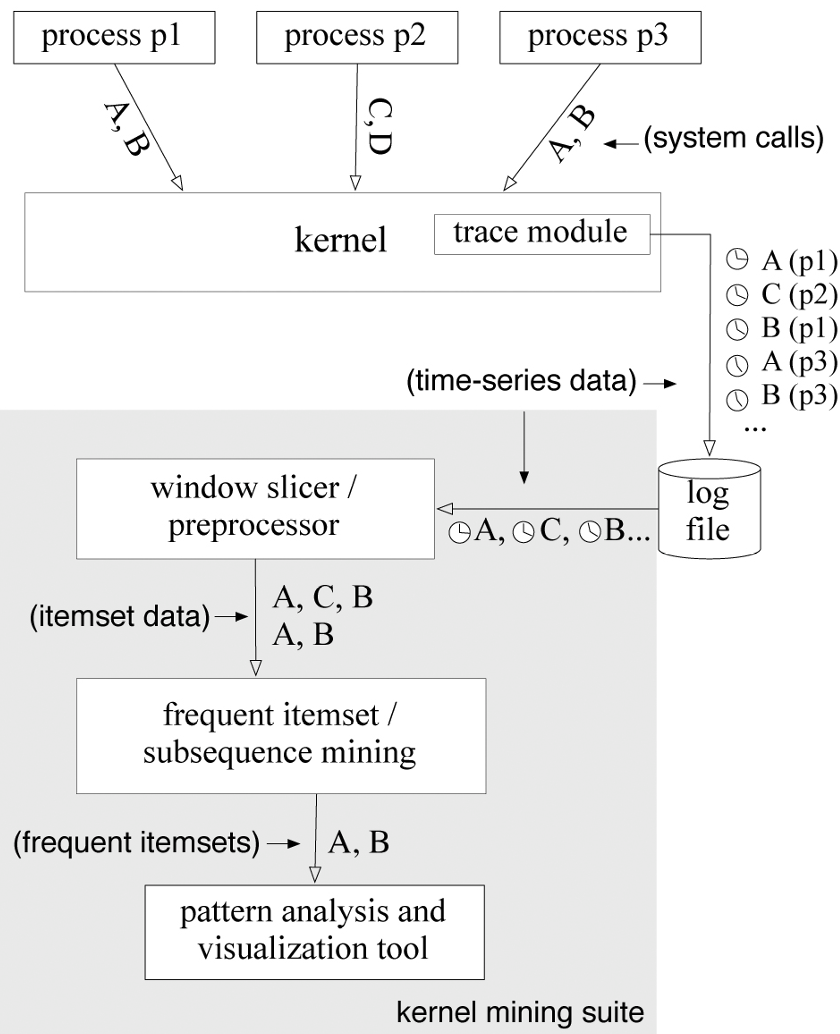
1. Window Folding & Slicing
To overcome this, the authors introduce a temporal relaxation:
- Window Folding: Events occurring within a specific time window (the "folding window") are considered to have happened in parallel. This removes the "strict ordering" constraint that makes kernel mining so brittle.
- Window Slicing: The continuous trace is sliced into discrete chunks. All events in a slice are bundled into a single "itemset."
2. Maximal Frequent Itemset (MFI) Mining
Instead of looking for all patterns, the system looks for maximal ones. If a pattern {Read, Write, Alloc} is frequent, we don't need the system to report {Read, Write} separately. This drastically reduces "output noise," making the results interpretable for a human engineer.
Experimental Evidence: Catching the 'gtik' Bug
The authors tested their framework against a known-buggy version of the GNOME stock ticker (gtik). This applet famously caused system-wide lag by over-communicating with the X Server.
- The Baseline: Using traditional tools required five complex, ad-hoc dTrace scripts and deep knowledge of X11 internals.
- The Mining Approach: The framework delivered a clear result with only two frequent itemsets. One was "system noise" (the X server doing its job), and the other clearly showed the
gtikwrite/read pairing with synchronous memory allocations.
Parameter Sensitivity
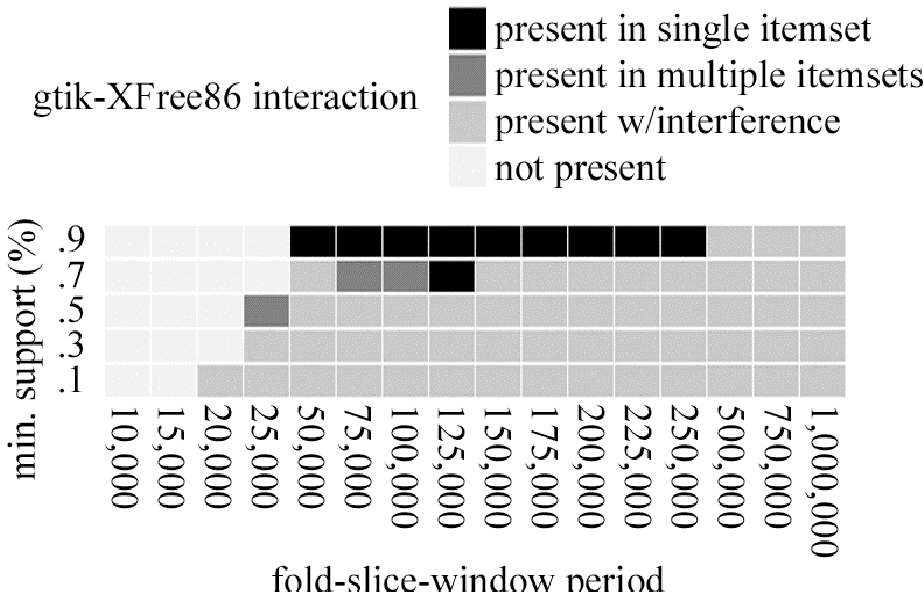
A key finding was the robustness of the folding window. As shown in the heatmap below, the "signal" (the problematic interaction) was detectable across a wide range of window sizes (25ms to 250ms). This suggests that sysadmins don't need to perfectly tune the algorithm to get useful results.
Critical Analysis & Future Outlook
The beauty of this approach lies in its Inductive Bias. By assuming that "temporal proximity equals logical correlation," the authors bypass the need for a formal model of OS behavior.
Limitations:
- Lost Ordering: By treating events as parallel, you might lose the ability to detect specific race conditions where the order of
Lock -> Unlockis the actual bug. - Window Slicing Errors: If a pattern straddles the boundary of two slices, it might be missed (though the authors argue a large enough minimizes this).
Future Impact: This framework paves the way for "Self-Healing Systems." Imagine a kernel that constantly mines its own trace data in the background, alerting administrators not just that the "CPU is high," but that "Process X and Process Y are engaged in an abnormally frequent and inefficient communication pattern."
Conclusion
This paper successfully bridges the gap between data mining and systems engineering. It moves kernel analysis away from the "search for a needle in a haystack" and toward a "detecting the structural magnetism of the needle" approach.