
Actuarial Glass Ceilings: A Data Science Audit of Gender Inequality in Research
An exploration of gender gap using advanced data science tools: actuarial research community
This study investigates the gender gap in the actuarial research community using an automated data science pipeline. By analyzing 2,655 publications from six premier journals (2005–2018) via web scraping and R-based gender classification, the authors provide a rigorous quantitative assessment of publication counts, social collaboration networks, and citation disparities.
TL;DR
Is the actuarial research community as inclusive as it claims to be? This study leverages web scraping, R-based gender classification, and Poisson mixture modeling to audit 14 years of publication data. The verdict: a significant gender gap persists, characterized by isolated female networks and a "citation penalty" where male-authored and mixed-gender papers dominate the field's impact metrics.
Background: Beyond the Anecdotes
For years, anecdotal evidence suggested that women were under-represented in actuarial science. While industry reports from the Society of Actuaries (SOA) and Casualty Actuarial Society (CAS) hint at a 30% female membership, the academic "visibility"—how often women publish and how frequently they are cited—has remained a black box. This paper shines a light on these patterns, framing the disparity within the Matthew Effect: the sociological phenomenon where the "rich get richer," and early academic success leads to disproportionate future rewards.
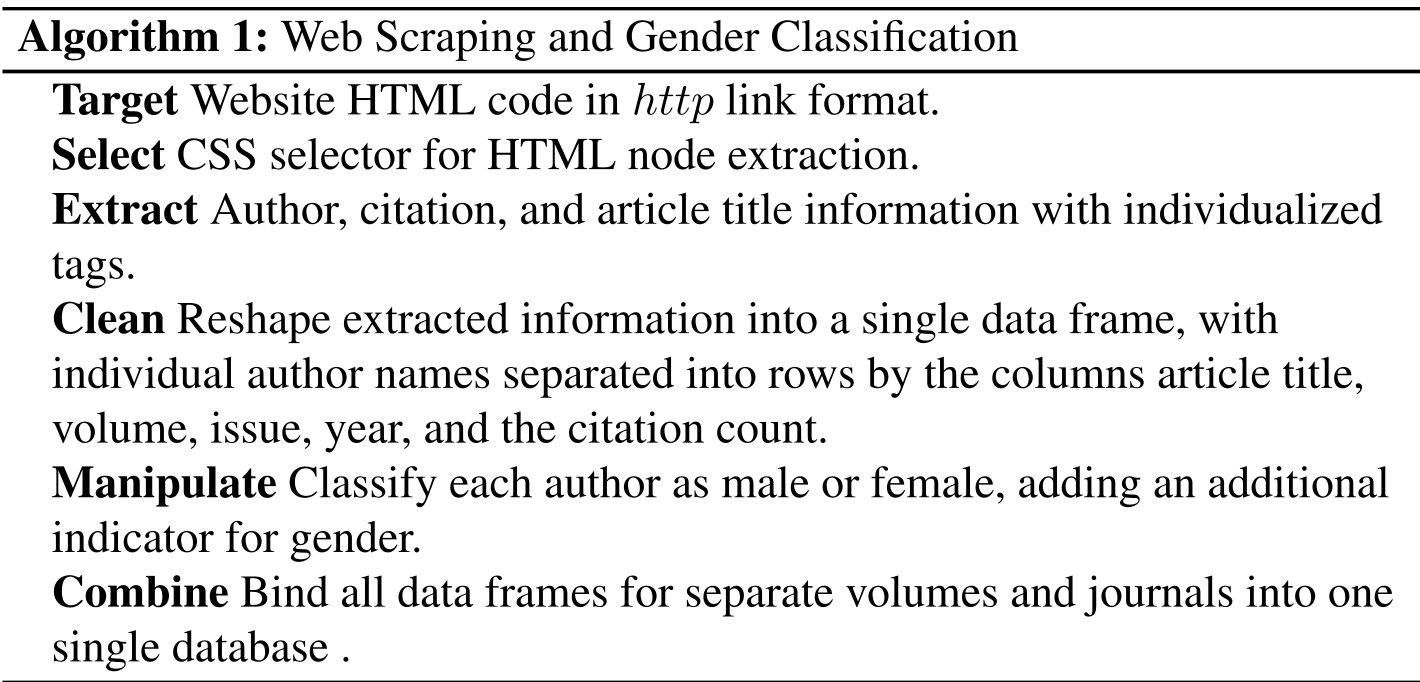
The Pipeline: Scraped, Classified, and Clustered
The researchers developed a sophisticated R-based workflow to process nearly 3,000 articles from six leading journals (AAS, ASTIN, BAJ, SAJ, IME, and NAAJ).
- Extraction: Using
rvestandSelectorGadget, the team bypassed manual data entry to build a comprehensive database of authors and citations. - Classification: By connecting to the
genderize.ioAPI, the authors predicted gender from first names, using a probability threshold to ensure academic rigor. - Networking: Utilizing
GGallyandsna, the study visualized the "collaborative topology" of the field.
The Methodology at a Glance
Collaborative Isolation: The Network Gap
One of the most striking findings comes from the Social Network Analysis (SNA). The researchers compared "Male Exclusive" vs. "Female Exclusive" networks.
The male network (Network 1) is a dense, "spider-web" of connections where local bridges connect disparate research groups, allowing ideas to spread. In contrast, the female network (Network 2) is sparse and simple. Female researchers are far more likely to work in isolation or in very small, disconnected groups.
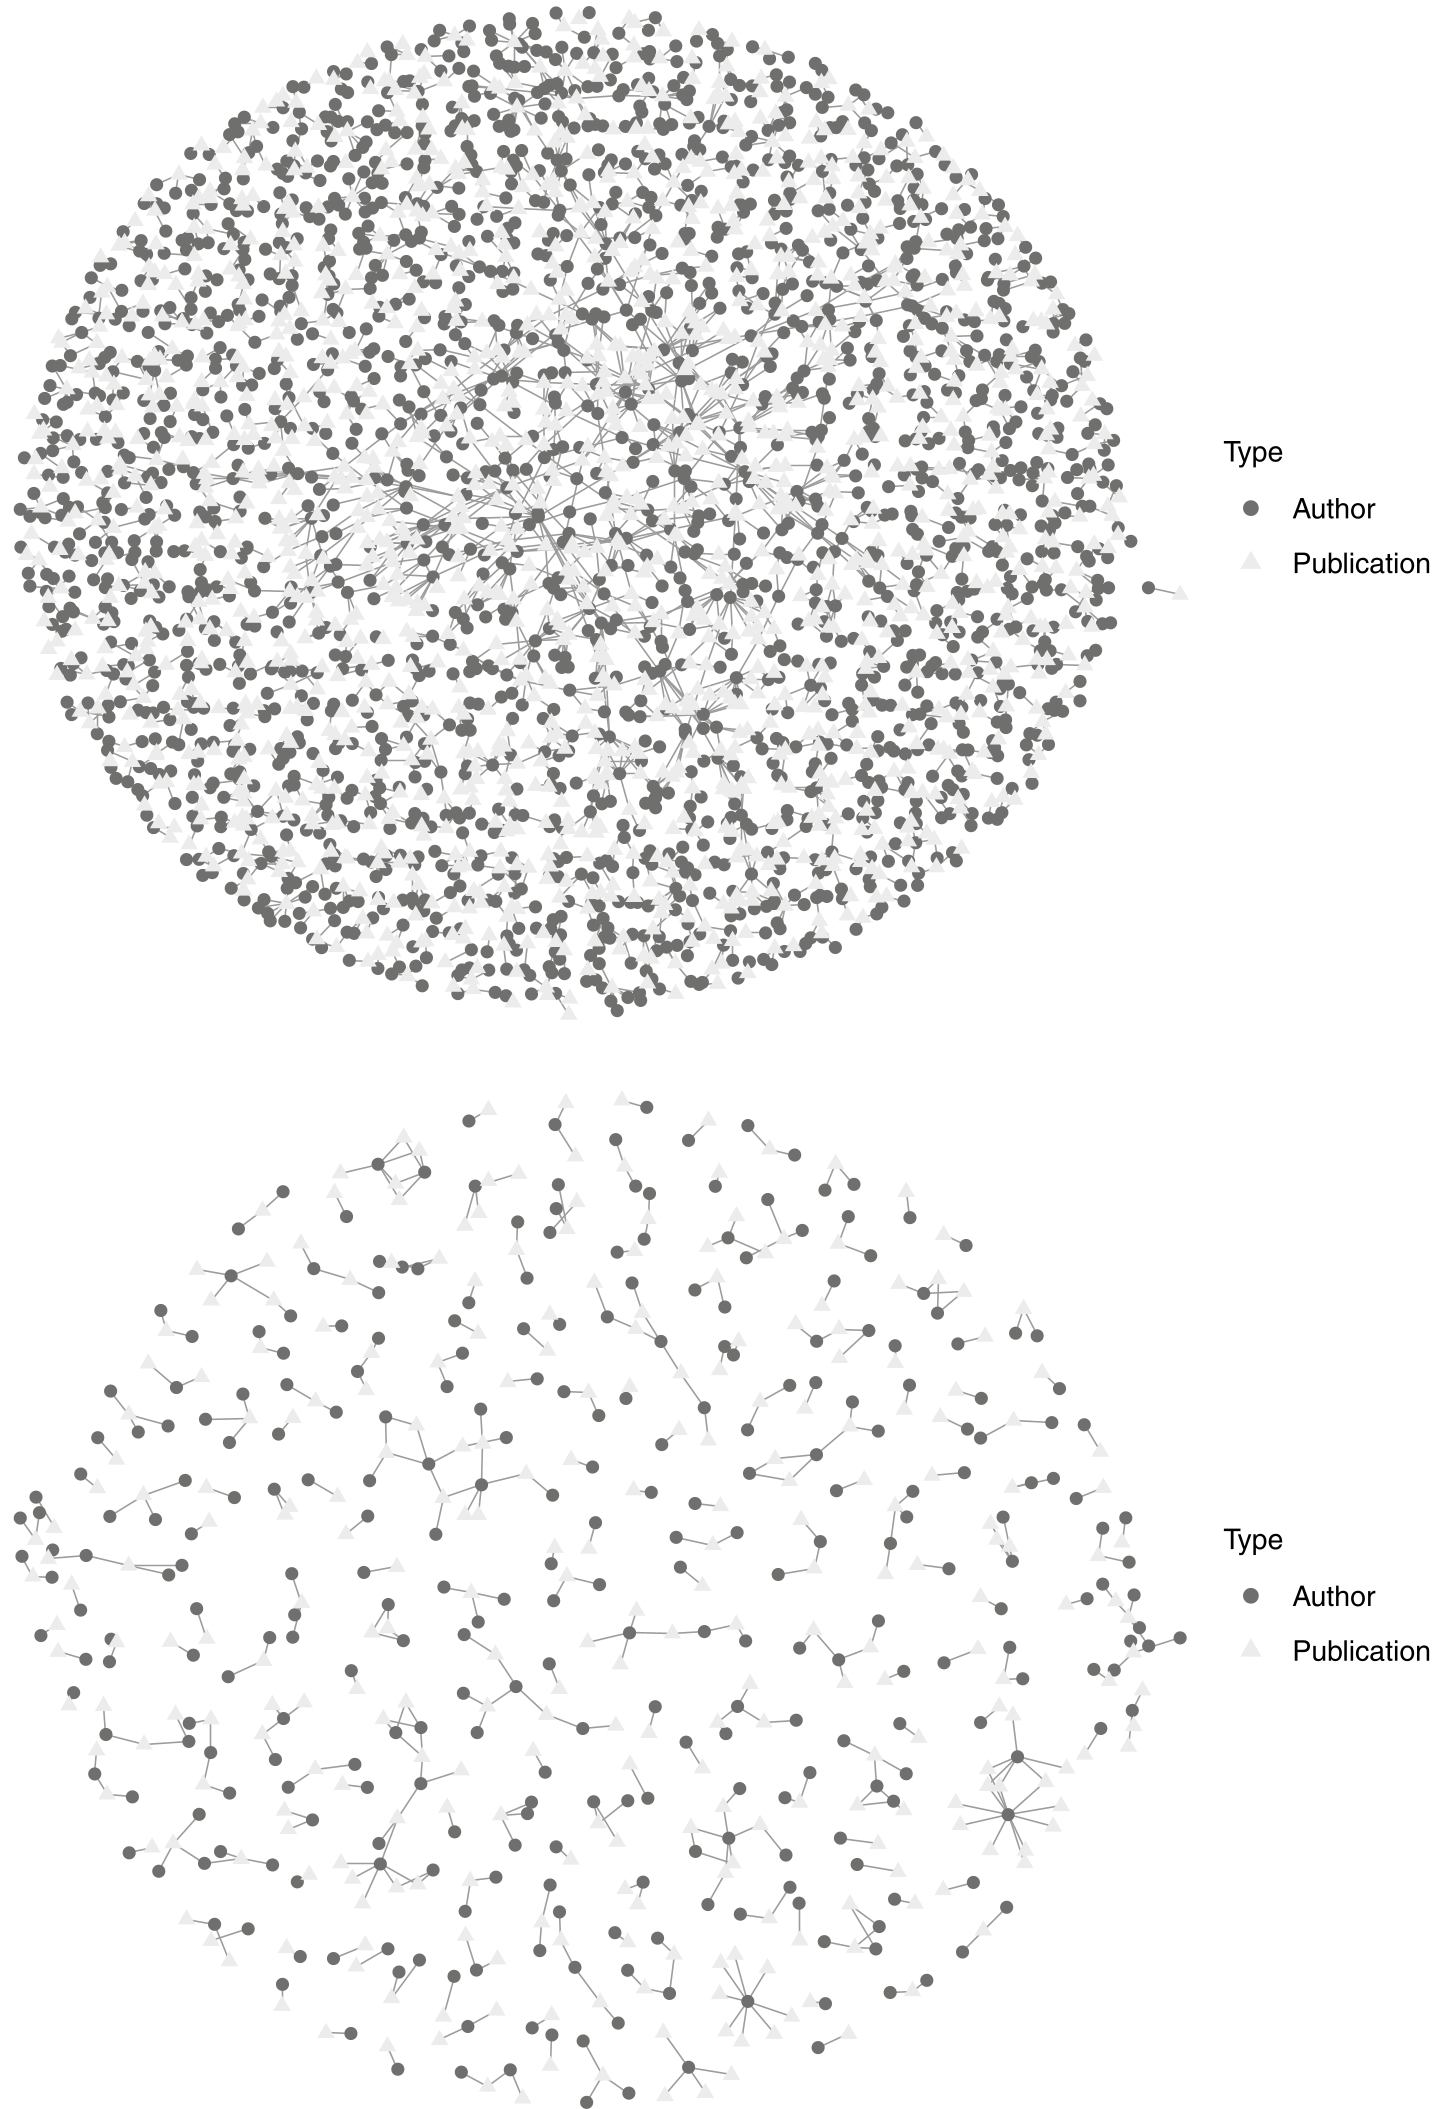 Fig 2: The top graph shows the robust male collaboration network; the bottom graph highlights the relative isolation of female authors.
The Citation Penalty: A Poisson Mixture Perspective
To understand why certain papers get cited more than others, the authors used a Poisson Mixture Model. This approach is superior to standard regression because it accounts for "heterogeneity"—the fact that some papers belong to a "super-star" cluster while others naturally have zero to low citations.
Key Insights:
- Authorship Matters: Male-only or mixed-gender papers receive significantly more citations on average than female-only papers.
- The Elite Cluster: The "influential" cluster (Cluster 2) is almost entirely populated by male authors.
- The Mix Advantage: Interestingly, mixed-gender collaborations (Male + Female) perform significantly better in citations than female-only groups, suggesting that male co-authors may provide the "social capital" needed for visibility.
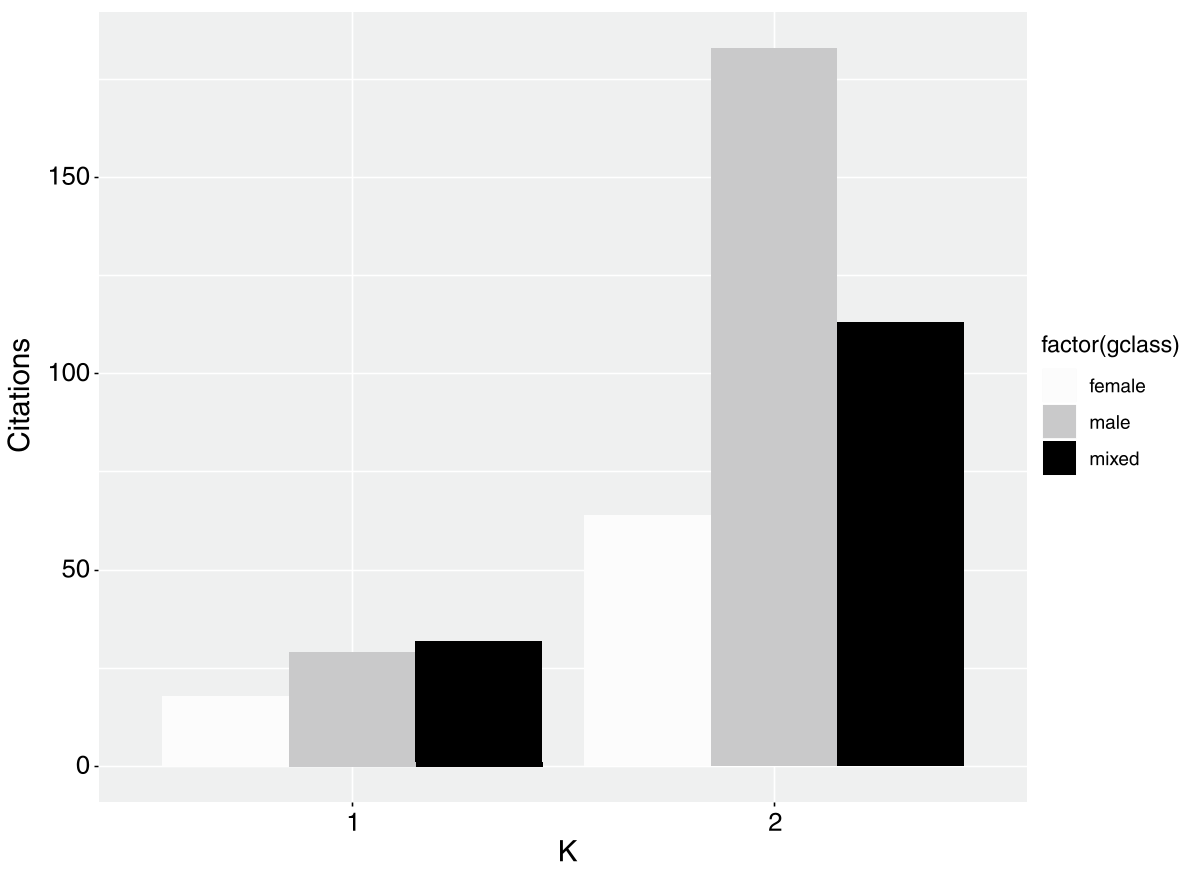 Fig 4: Distribution of articles (top) and citations (bottom) by authorship category across identified clusters.
Critical Insight: Breaking the Matthew Effect
The study concludes that the gender gap is self-reinforcing. Because women are cited less and collaborate in smaller circles, they may have lower success rates in tenure and funding applications, which further reduces their publication output.
Recommendations for the Industry:
- Collaborative Structures: Actuarial societies should sponsor conferences specifically for women (modeled after ASA's WSDS) to build these missing "local bridges."
- Funding Equity: CAS and SOA should investigate if the "Matthew effect" influences how research grants are awarded.
- Mentorship: Proactive mentorship is needed to help female researchers move from isolated "nodes" to central "hubs" in the research network.
Conclusion
This paper is a wake-up call for the actuarial community. It proves that diversity is not just about the number of people in the room; it is about the connections they make and the recognition their work receives. Until the female research network becomes as interconnected as the male one, the field's full intellectual potential will remain untapped.