
Inside Fitcolab: How Academic Lifecycles and Social Attributes Shape Online Networks
General Network Properties of Friendship Online Social Network
This paper presents a comprehensive empirical analysis of the "Fitcolab" experimental Online Social Network (OSN). It utilizes longitudinal data to investigate web usage metrics and structural network properties such as reachability, clustering coefficients, and degree distributions over a 131-day period.
TL;DR
This research dives into the "Fitcolab" experimental social network to understand how online friendships actually form and evolve. By tracking 209 users over 131 days, the study reveals that online activity is not random; it is tightly coupled with real-world academic pressures (like midterms) and is heavily influenced by student status (on-campus vs. distance learning).
Background: The Social Graph in a Microscope
Understanding Online Social Networks (OSNs) usually involves massive, anonymized datasets from giants like Facebook or X (formerly Twitter). However, this paper takes a "micro-level" approach by observing an experimental system from its inception. This allows for a unique longitudinal view—watching a social world be born and observing the "friction" that shapes its growth.
Problem & Motivation: Beyond Static Snapshots
Most network studies capture a single point in time, missing the process of expansion. The author argues that we need to see how metrics like density, reciprocity, and clustering move over time. Furthermore, the motivation was to see if "real-world" status (like being a distance learner) creates "digital silos" in what should be an open social platform.
Methodology: The Longitudinal Lens
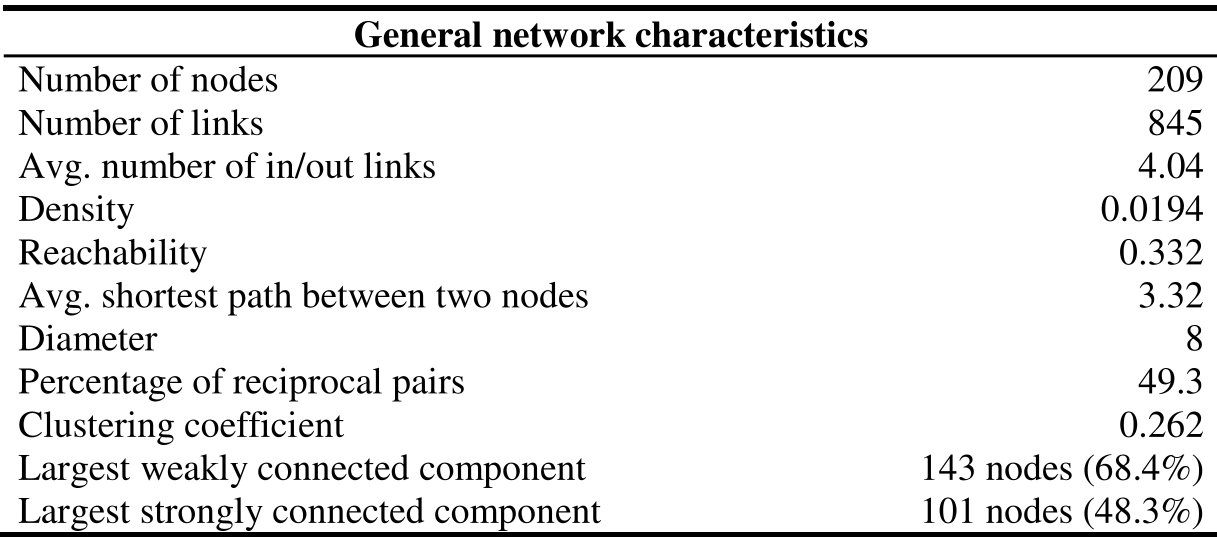
The study monitored 209 users. A critical technical decision was defining a "visit" using a 30-minute idle threshold to ensure data accuracy. The network was analyzed using:
- Usage Metrics: Visits, duration, and active user counts.
- Structural Metrics: In/Out degree distributions and the "Small World" property.
- Dynamic Snapshots: Measuring changes in density and reachability every 14 days.
Key Findings: The Pulse of the Network
1. The "Exam Peak" Phomenon
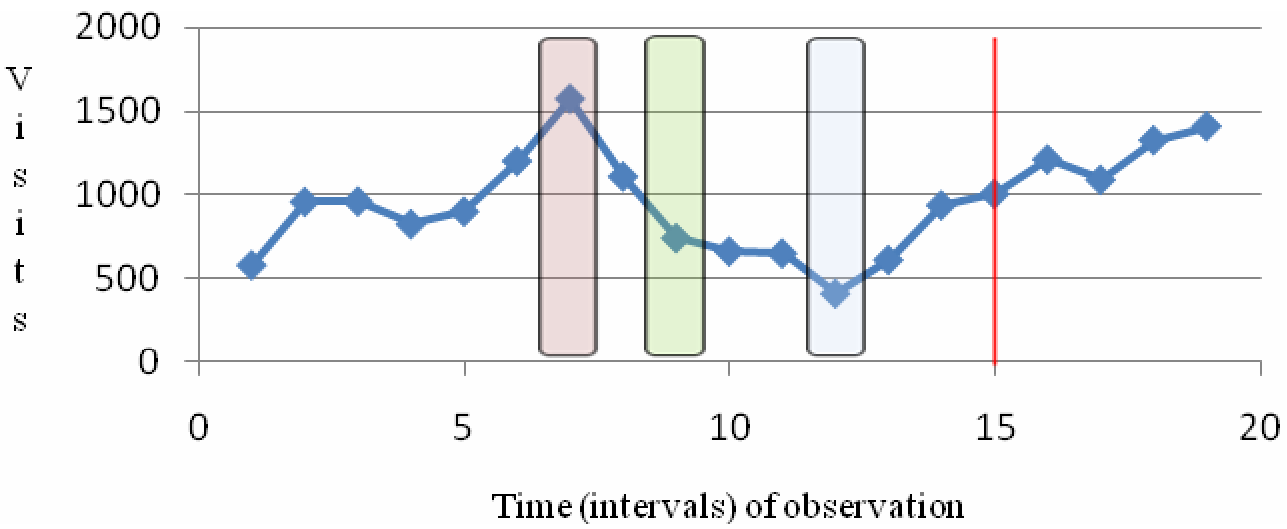
Data showed that network activity isn't consistent. There is a "rapid increase" in popularity during midterm weeks. Users don't just log in more often; they stay longer. This suggests that the OSN serves as a critical stress-relief or coordination hub during high-pressure periods.
2. Friendship is a Two-Way Street
The reciprocity rate was found to be 49.3%. In the world of social graph theory, this is quite high, suggesting that online friendships in this context are reflections of mutual real-world acquaintances rather than "parasocial" following (which we see on platforms like Instagram).
3. The Digital Divide: Social Segregation
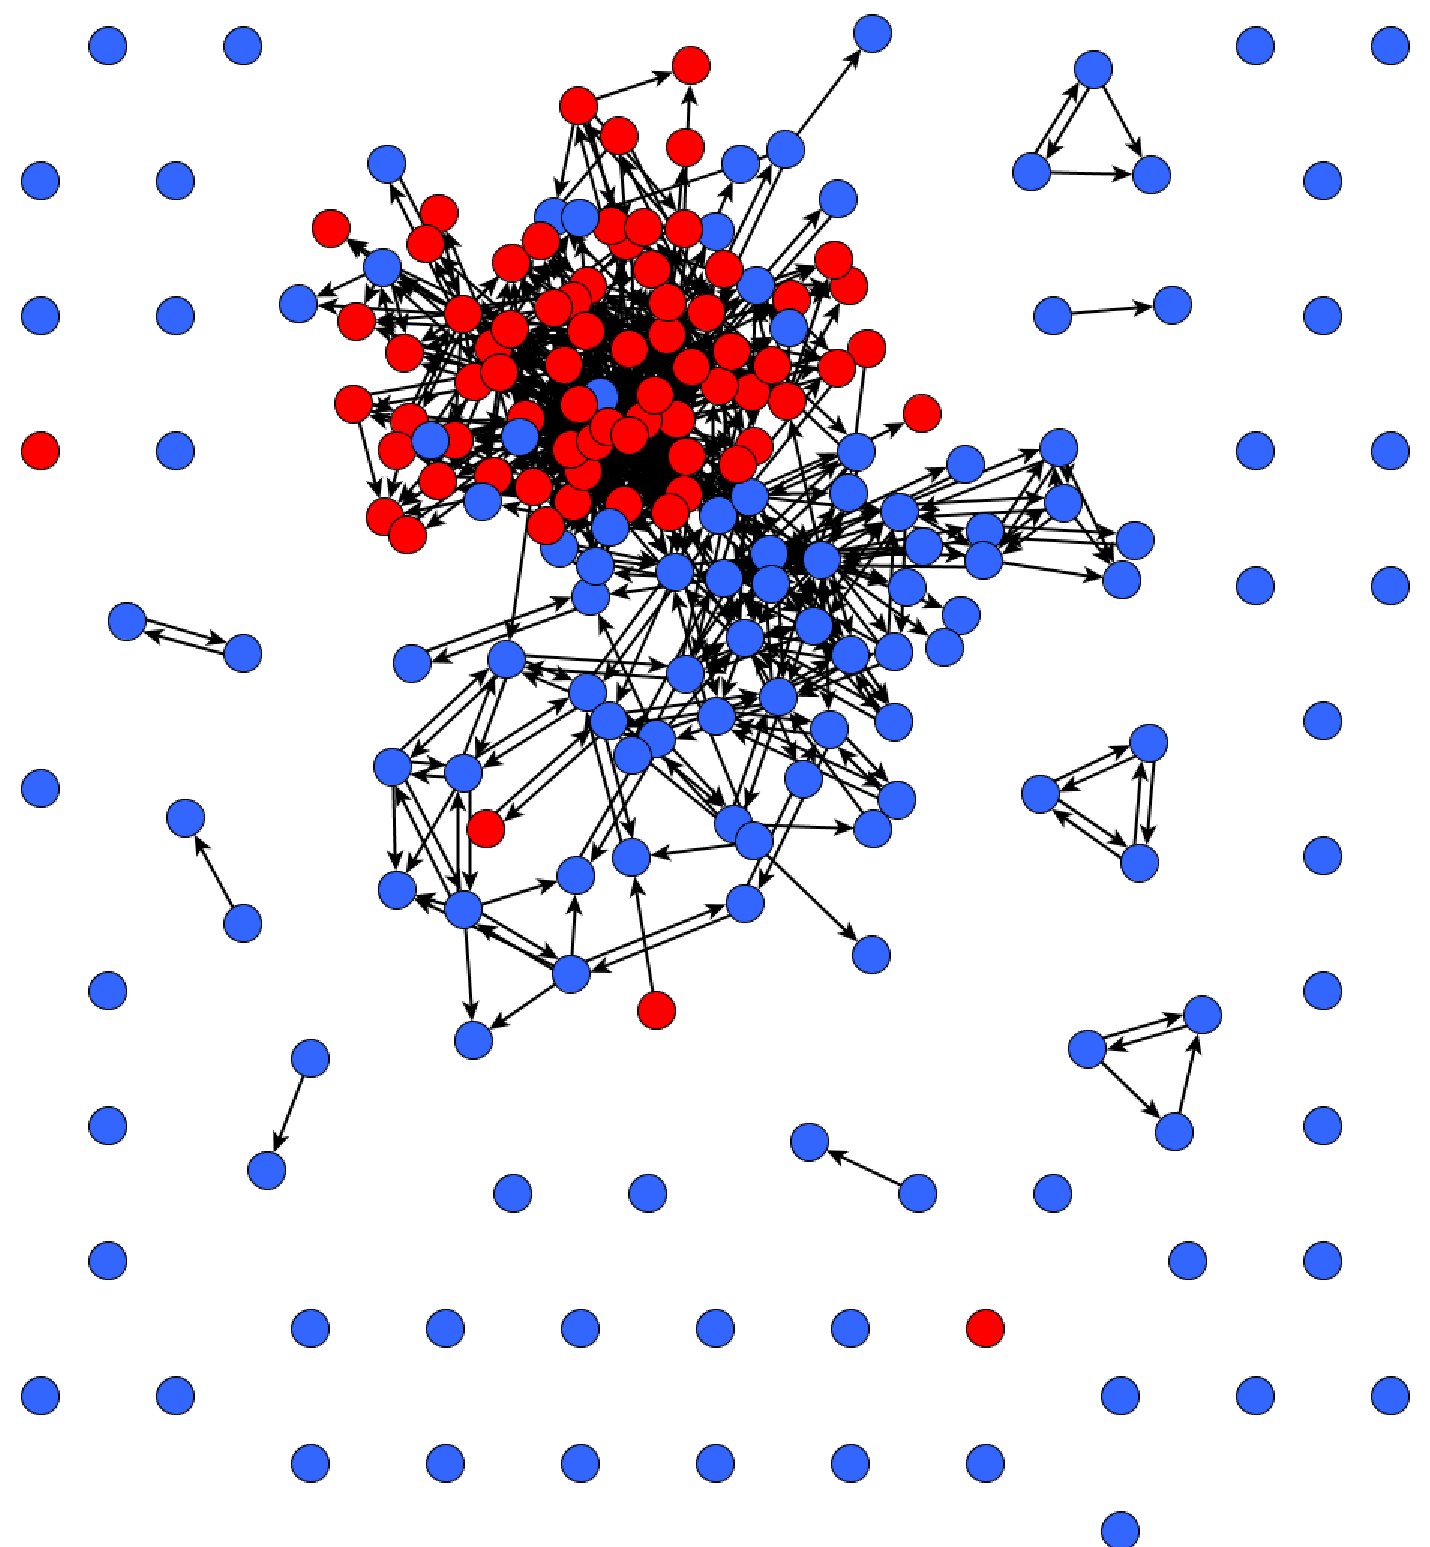
Perhaps the most striking finding came from the visualization. Using a stress-minimization algorithm, the author mapped the network. The result? A clear divide.
- Red Nodes (On-campus students): Densely connected and central.
- Blue Nodes (Distance learners): Frequently isolated or on the fringes.
Critical Analysis & Takeaways
This paper proves that homophily (the tendency of individuals to associate with similar others) is a dominant force even in new digital spaces. The "distance learning" tag acted as a barrier to integration.
Limitations: The sample size is small (209 users), which limits the generalizability to global-scale OSNs. However, as an "in-vitro" experiment, it provides high-fidelity insights into the early-stage formation of social links.
Conclusion: For developers and researchers, the takeaway is clear: if you want to build a successful community platform, you must account for the offline rhythms (schedules) and existing social identities of your users. The "Network" is not just code—it is an extension of biological and social reality.