
Mapping the Invisible: Reconstructing Illegal Drug Networks from Survey Data
Generating Networks of Illegal Drug Users Using Large Samples of Partial Ego-Network Data
This paper presents a methodology for reconstructing large-scale youth social networks using partial ego-network data from the National Household Survey on Drug Abuse (NHSDA). By matching respondents based on self-reported drug use and the perceived prevalence of use among their friends, the author generates population-level network models to assess the structural risk of drug exposure across different metropolitan areas.
TL;DR
Socially learned behaviors like drug use are intrinsically tied to friendship networks. This paper explores a novel statistical method to transform individual survey responses from the NHSDA into large-scale "hypothetical" friendship networks. By doing so, it reveals how drug users cluster, how sellers occupy "bridge" positions, and how these structures vary drastically between different American cities.
Background: The Social Contagion of Use
Drug use is rarely an isolated choice; it is a socially learned behavior often mediated by peer influence. While we know that users tend to have peers who also use, academic research has long struggled to move from "ego-networks" (one person and their immediate friends) to "whole-networks" (how an entire city is connected). The challenge is simple: you cannot easily map a secret society.
Problem & Motivation: The Data Gap
Existing research is often restricted to localized clusters. We lack a "birds-eye view" of how the risk of contact between non-users and sellers fluctuates across different geographic regions. The author’s insight was to realize that if we know the proportions of friends who use (none, few, most, all), we can mathematically infer the aggregate connectivity of the population.
Methodology: From Partial Data to Global Graphs
The core of this method lies in the Friendship Ratio.
1. Defining the Differential
Using data from 1979 and 1982, the author first established that users and non-users do not have the same number of friends. Users typically belong to larger, more active social circles.
2. The Matching Algorithm
The paper uses equations to balance the "ties sent" and "ties received." If a user says "most of my friends are users," the algorithm must find other users in the dataset to satisfy that link.
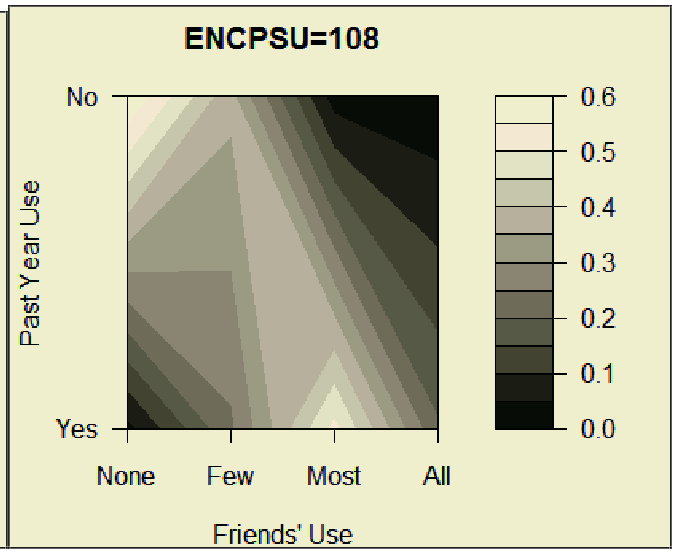 Fig 1: Contour plots showing how personal use correlates with friendship circle composition across different regions.
3. Network Simulation
Through Monte Carlo sampling, the author generates 100 versions of these networks to ensure the results aren't fluke occurrences. This transforms a static table of numbers into a dynamic map of "Geodesic Distances" (the shortest path between any two people).
Experiments & Results: The "Bridge" Effect
The study compared two different Metropolitan Statistical Areas (PSUs).
- PSU 116 (South Central US): Users were highly clustered. Sellers were located at the "core" of the user network, acting as a functional hub.
- PSU 108 (Pacific State): A much denser network with higher overall usage (25%). Interestingly, users here were less centrally located, suggesting a more "normalized" or spread-out social structure for the drug's presence.
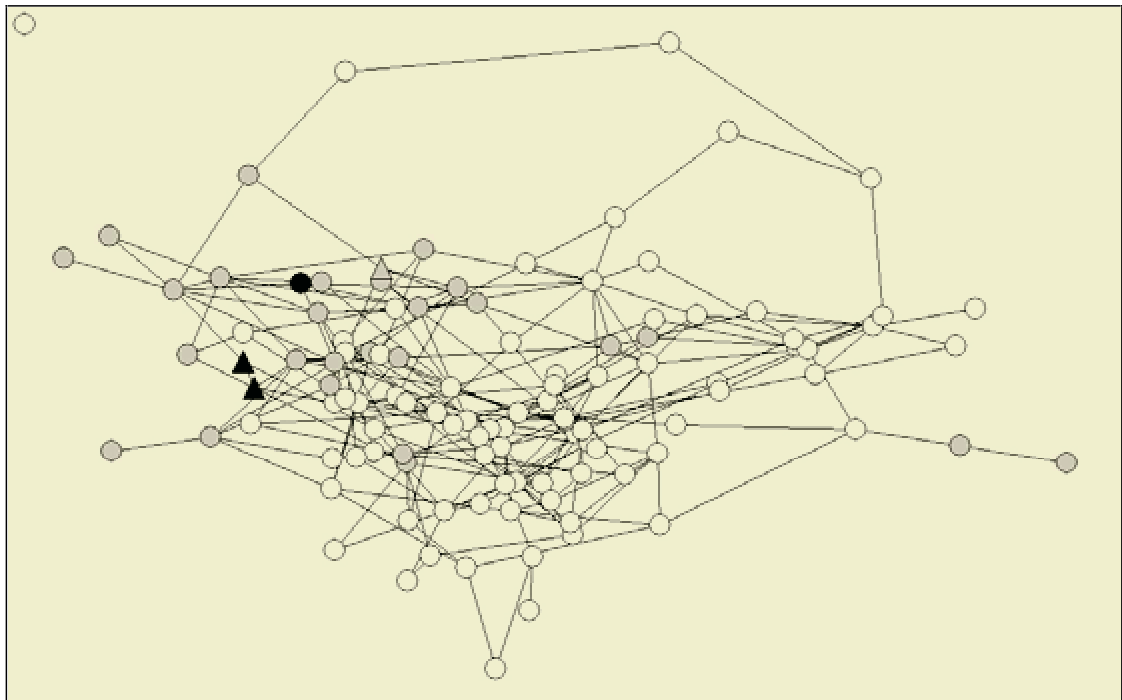 Fig 2: A reconstructed network for PSU 108. White nodes are non-users, grey are users, and black are sellers. The clustering shows the "core-periphery" structure of the illegal market.
Key Metrics:
- Betweenness Centrality: Users scored significantly higher (7.21%) than non-users (1.99%), proving that drug-using sub-populations act as the "bridges" through which influence spreads to "normal" social groups.
- Parental Influence: The data showed a "protective" network effect. Youths who confided in parents were structurally more distant (longer path lengths) from drug sellers.
Critical Analysis & Conclusion
Takeaway
The study proves that we don't need to interview every person in a city to understand its social health. By smartly "stitching" together partial ego-network data, we can create a proxy of the whole system. This has massive implications for Intervention Strategy: instead of broad anti-drug campaigns, policy can target "high-betweenness" nodes to break the bridges of influence.
Limitations & Future Work
The model currently assumes that "few" and "most" mean the same thing to everyone (which is likely a simplification). Future iterations could benefit from incorporating Homophily—the tendency for people to associate with others of the same age, gender, or ethnicity—to make the reconstructed graphs even more realistic.
Ultimately, this work turns demographic surveys into a tactical map for social science.