
Beyond Random Graphs: Synthesizing the Social Fabric of the United States for Epidemic Modeling
GENERATION AND ANALYSIS OF LARGE SYNTHETIC SOCIAL CONTACT NETWORKS
The paper presents a "first principles" methodology for generating large-scale synthetic social contact networks for the entire US population. By integrating census data, activity surveys, and land-use records, the authors construct high-fidelity agent-based models that simulate 24-hour activity sequences for millions of individuals to study disease diffusion dynamics like influenza.
TL;DR
Researchers at Virginia Tech have developed a massive-scale framework to simulate the daily movements and physical contacts of every individual in the US. By moving away from abstract random graph theory and toward a "first principles" approach—using real census and activity data—the study reveals that urban structure and demographics are the primary drivers of how diseases like influenza spread through cities.
Background: The Limits of Mathematical Abstraction
For years, network scientists relied on elegant but simplified models like "Scale-Free" or "Small-World" networks. While these models capture certain mathematical truths, they fail in the real world of public health. Why? Because a virus doesn't care about "nodes" and "edges" in the abstract; it cares about a student sitting in a classroom in Seattle or a commuter on a subway in NYC.
The authors argue that to understand an epidemic, we must first reconstruct the city itself—its houses, its workplaces, and the specific minute-by-minute schedules of its inhabitants.
Methodology: Engineering a Synthetic Society
The "First Principles" approach is a three-tiered data fusion process:
- Population Synthesis: Using Iterative Proportional Fitting (IPF), the researchers create "synthetic humans." These agents are demographic clones of real populations, matching census distributions (age, income, household size) without violating individual privacy.
- Activity Assignment: Each synthetic person is given a "template" derived from time-use surveys. If you are a 35-year-old worker, your agent will have a schedule that includes commuting, working, and shopping.
- The Gravity of Location: To decide where these activities happen, the team uses a Gravity Model. The probability of an agent visiting a specific location is proportional to its "attractiveness" and inversely proportional to the distance from their home.
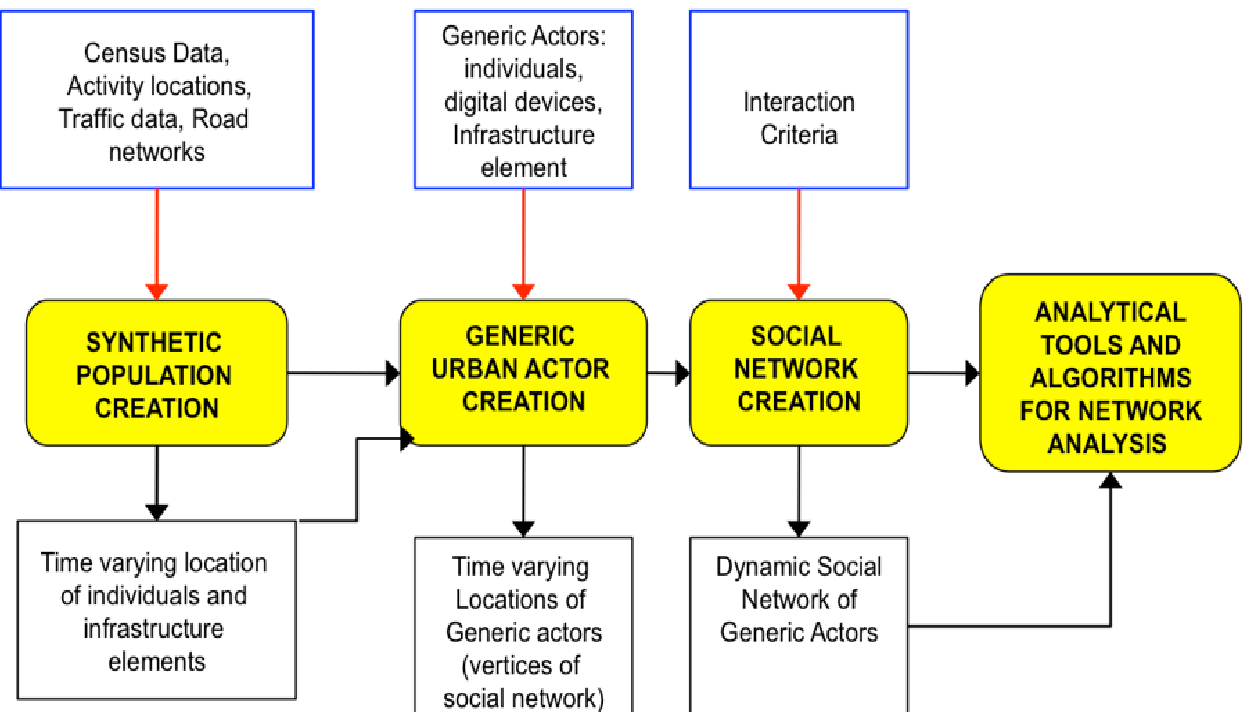 Figure 1: The architecture of the synthetic network generation, transforming raw data into a dynamic person-location bipartite graph.
The "Not-So-Random" Reality
The most striking finding is that these realistic networks differ fundamentally from the random graphs found in textbooks.
- No Power Laws: Unlike the Internet or certain social media networks, physical contact networks do NOT follow a simple power-law degree distribution. They are multi-modal, influenced by the physical capacity of locations (like schools and offices).
- High Clustering: Real networks show much higher "clique" counts. In the real world, your friends are likely to know each other, a feature often lost in randomized versions of the same network.
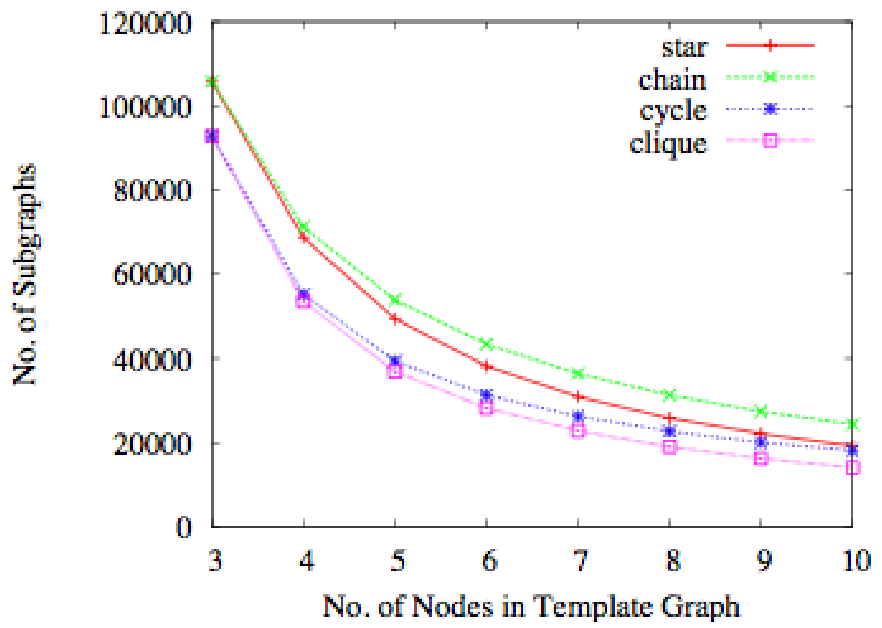 Figure 2: Comparing subgraph counts (cliques, cycles) between the real contact network (left) and a randomized version (right).
Results: Why Los Angeles is Different from Seattle
By running influenza simulations on three major metros——NYC, LA, and Seattle——the researchers discovered that even when using the same methodology, the structure of the city changes the outcome:
- Los Angeles (LA) demonstrated the highest infection rates. The authors trace this back to the Reproductive Number (R0) distribution, which was shifted higher in LA due to its specific contact patterns.
- The School Effect: In every city, school-aged children were the primary "engines" of the epidemic, showing the highest attack rates across all demographics.
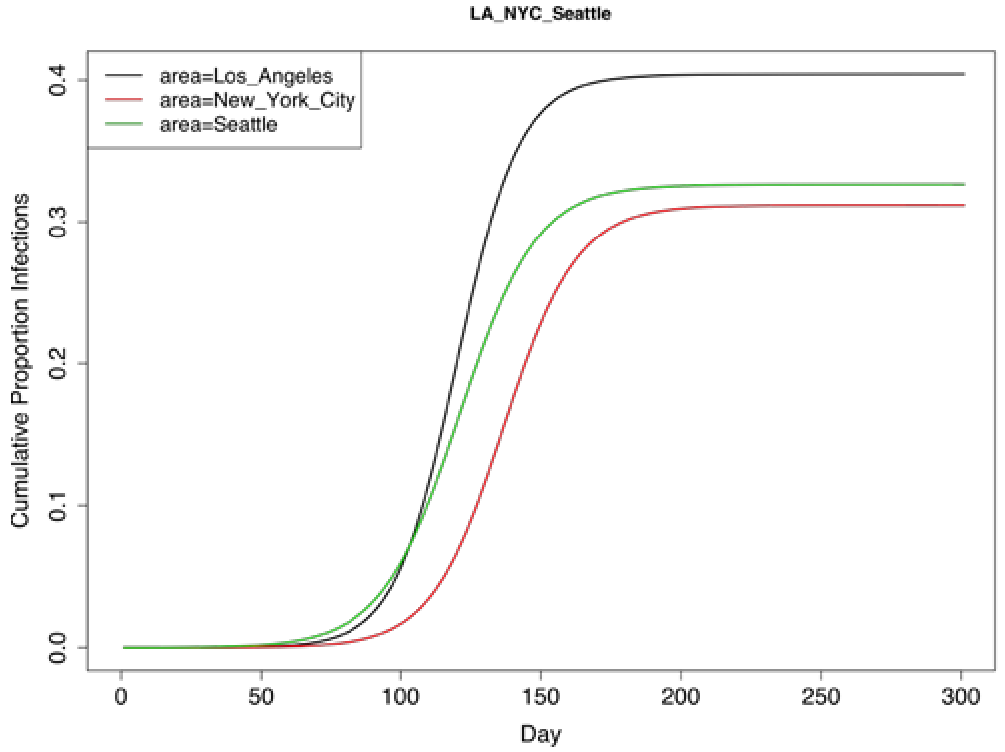 Figure 3: Infection curves across different cities and age groups, highlighting the vulnerability of the school-aged population.
Critical Insight: The Value of Labels
The core takeaway is that unlabeled graph measures are insufficient. Knowing the average number of contacts (degree) isn't enough to predict an outbreak. We need "labels"—knowing that a contact happened at a "School" rather than a "Shop" and that the person is a "Senior" rather than a "Preschooler."
Conclusion & Future Outlook
This work marks a shift from "Network Science as Mathematics" to "Network Science as Engineering." By building a digital twin of the US population, the NDSSL team at Virginia Tech provided a tool that was instrumental in national policy planning (including the MIDAS project).
The logic is clear: to protect a society, you must first be able to replicate its complexity. Future work will likely focus on even more granular scales, such as indoor air-flow modeling or long-distance inter-city travel patterns, further bridging the gap between synthetic models and our messy, physical reality.