
GGTLQTM: Bridging the Gap Between Global Satellite Imagery and Local Economic Indicators
13812_A Generic Global-to-Local Quantitative Transformation Model (GGTLQTM) for Modeling Socioeconomic Indicators From DMSP-OLS Nighttime Light Imagery.
The paper introduces the Generic Global-to-Local Quantitative Transformation Model (GGTLQTM), a novel framework designed to estimate small-scale socioeconomic indicators (GDP and Population) directly from large-scale DMSP-OLS Nighttime Light (NTL) imagery. By utilizing various linear and nonlinear mathematical functions, the model achieves high estimation accuracy at the county level, with the quadratic polynomial identified as the optimal transformation function.
TL;DR
Researchers have developed the Generic Global-to-Local Quantitative Transformation Model (GGTLQTM) to extract localized socioeconomic data (like GDP and Population) from coarse, global-scale Nighttime Light (NTL) imagery. By moving beyond simple linear regressions and introducing a new accuracy metric called ANCV, the model proves that "global" satellite trends can accurately predict "local" small-scale realities.
Background: The Scale Dilemma in Remote Sensing
For decades, DMSP-OLS nighttime light imagery has been a gold mine for estimating human activity. However, its low spatial resolution often limits its use to national or provincial levels. As we move toward precision urban management, the industry faces a "Scale Gap": how do we use historical, large-scale satellite data to understand what happened in a specific small county or district?
Traditional "downscaling" often requires auxiliary high-resolution data that might not exist for historical periods. The GGTLQTM addresses this by establishing a direct functional link between global sums and local outputs.
Methodology: The Global-to-Local Logic
The core "Insight" of this paper is that local socioeconomic indicators are often a functional transformation of global intensity. The authors proposed two pathways (Ideas) to verify this:
- Idea 1: Global NTL Local NTL Local Indicators.
- Idea 2: Global NTL Global Indicators Local Indicators.
The model is "Generic" because it doesn't assume a simple linear relationship. It explores exponential, logarithmic, power, and polynomial functions.
The New Gold Standard: ANCV
To prevent the common trap of overfitting (where a model looks perfect on paper but fails in reality), the authors introduced Adjusted Normalized Cross-Validation (ANCV). This metric balances the number of parameters with cross-validation errors, ensuring the chosen model—often a quadratic polynomial—is truly the most robust.
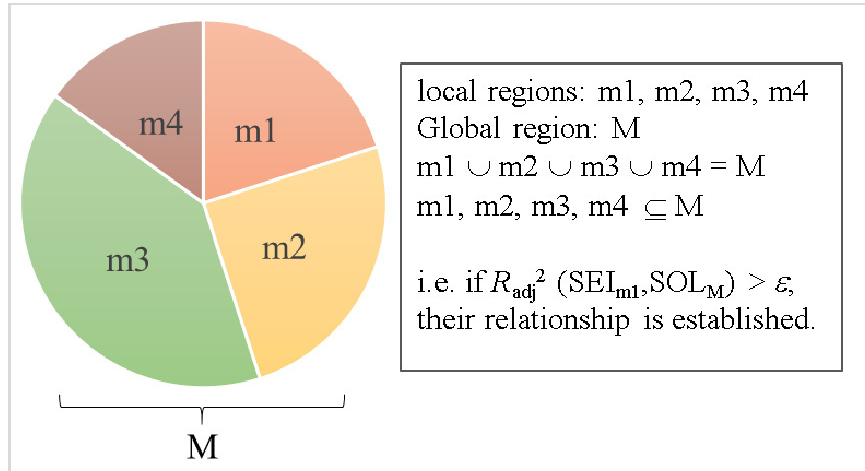
Experimental Results: The Case of Wuhan
The researchers tested the model across 13 districts of Wuhan using 20+ years of historical data.
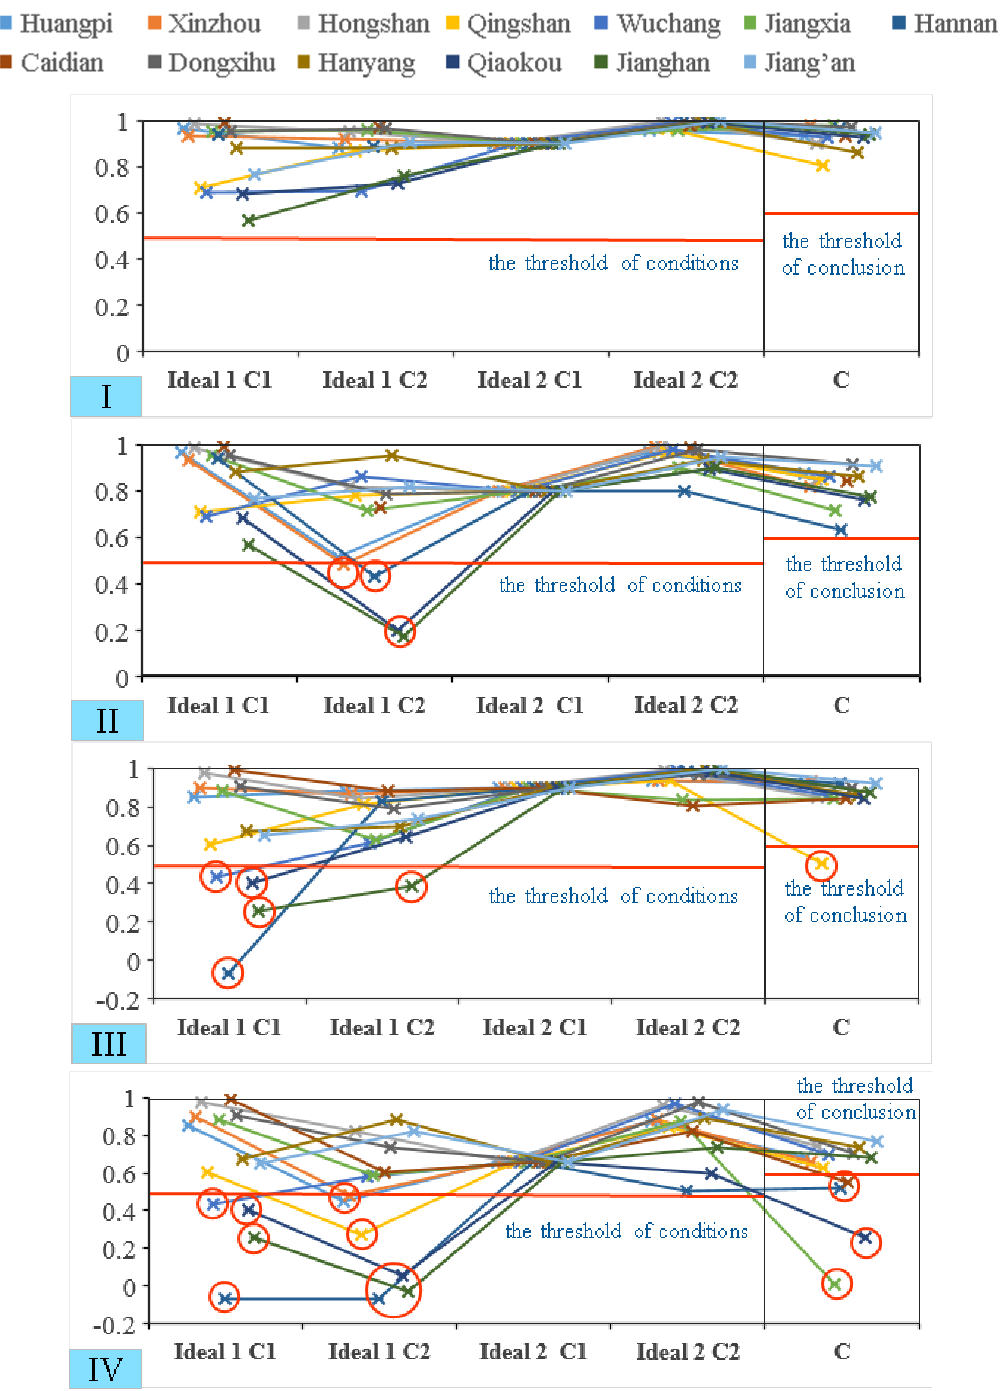
- Linear vs. Nonlinear: In many districts, traditional linear models failed to capture the nuances of urban growth. The GGTLQTM's nonlinear options (specifically the quadratic polynomial) significantly improved accuracy.
- Homogeneity vs. Heterogeneity: The model successfully identified districts like Hongshan that follow global trends closely (Homogeneous) versus others like Qiaokou that display unique local variations (Heterogeneous).
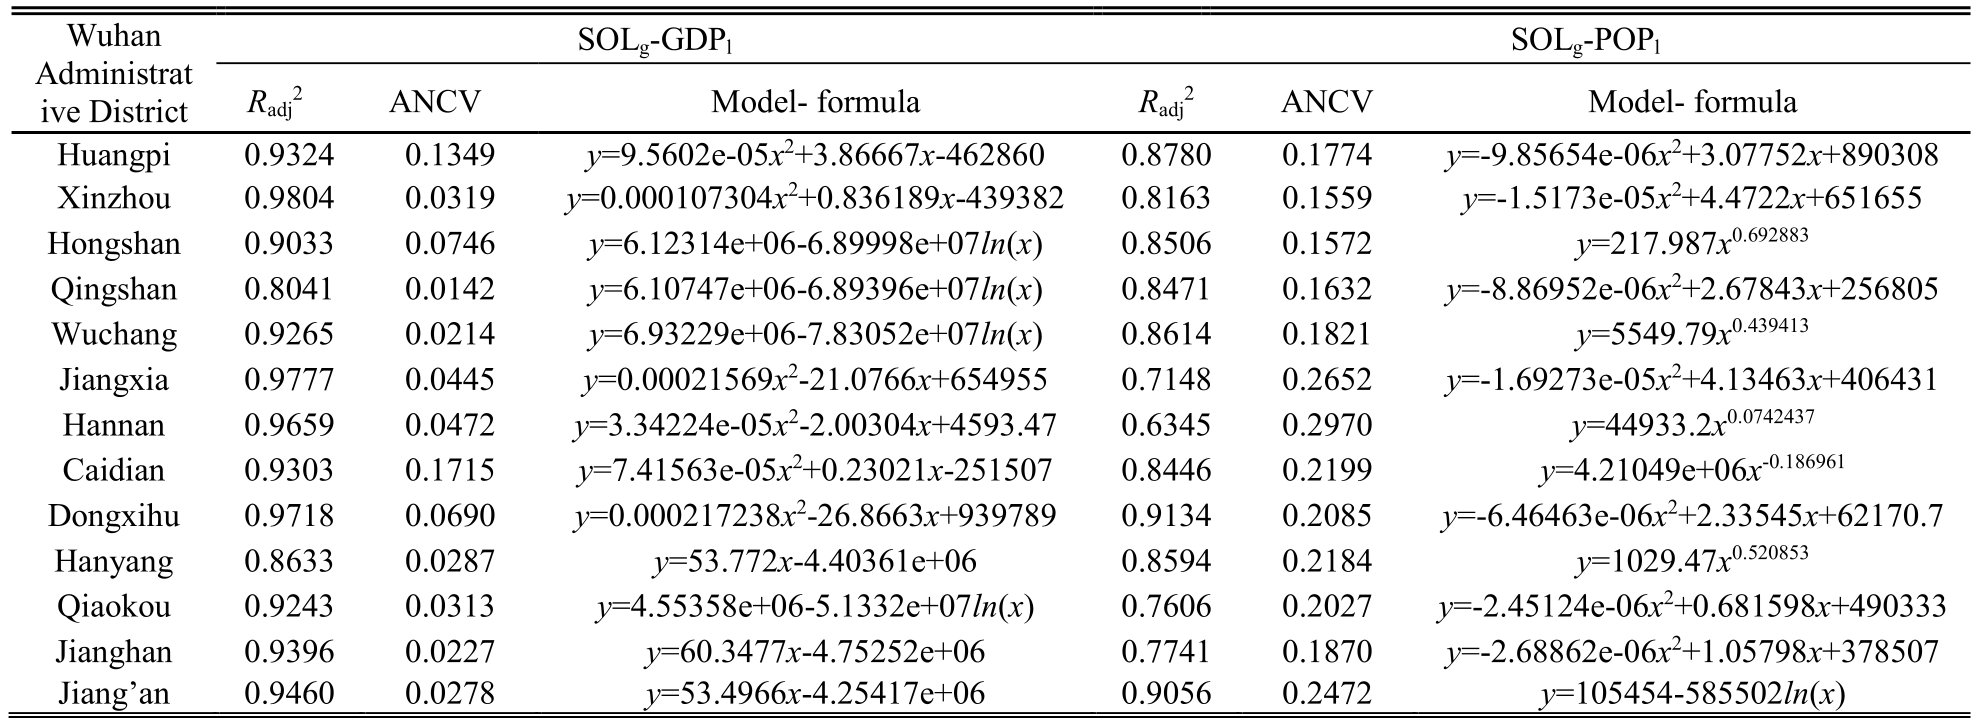
SOTA Comparison & Table Analysis
As shown in the table below, the values for GDP estimation in districts like Xinzhou reached a staggering 0.98, proving the model's high reliability.
Critical Insight & Future Outlook
The GGTLQTM is a breakthrough because it relaxes the strict hypothesis requirements of previous models. It acknowledges that the relationship between light and economy is not always 1:1 and can vary significantly due to local policies or geographic constraints.
Potential Limitations: The study was focused on Wuhan, a high-growth urban center. Future work should test this model in "NTL-saturated" megacities or extremely underdeveloped rural areas to check if the Taylor series approximation still holds.
Final Takeaway: For researchers and policymakers, this model offers a "time machine"—a way to look back at the economic trajectory of small administrative regions using the global satellite record with precision that was previously thought impossible.