
Geographic Impressions: Decoding the Hidden Patterns of Facebook Political Ad Funding
Geographic impressions in Facebook political ads
2021-02-22
Summary
Problem
Method
Results
Takeaways
Abstract
The paper presents a computational analysis of Facebook political advertising using network science to categorize funding entities. By analyzing "geographic impressions," the authors identify a distinct tripartite partitioning of advertisers based on whether their ads reach a single U.S. state or a national audience.
## Executive Summary
**TL;DR**: Researchers have discovered that the geographic reach of a Facebook ad is a "digital fingerprint" that reveals the underlying strategy and type of its funder. By analyzing millions of impressions, this study partitions the chaotic world of online political ads into three distinct groups, providing a new lens for transparency in an era of "dark money" and algorithmic obscurity.
**Strategic Positioning**: This work moves beyond simple descriptive statistics of ad spend, positioning itself as a structural analysis of political behavior using **Network Science**. It bridges the gap between raw data from the Facebook Ad Library and the sociological need for political accountability.
## The Transparency Gap: Why Online Ads are a Black Box
In the age of television, following the money was relatively straightforward. However, the 2018 midterm elections saw a **2400% increase** in digital spend. Unlike TV, online platforms allow for "amorphous groups" to run ads across multiple pages with varying names. This creates a "backlash-free" environment where unknown groups can influence voters without the accountability attached to a major political party.
The core challenge? Facebook's data is often provided in "bins" (e.g., spend between $100-$499) rather than exact figures, making traditional financial auditing difficult.
## Methodology: The Power of Geographic Concentration
The authors' key insight is that **geographic concentration** is not a spectrum but a binary-leaning distribution. Most ads are either hyper-local (100% of impressions in one state) or broadly national.
### Defining the Tripartite Partition
By calculating the maximum percentage of impressions a single region (U.S. state) receives, the researchers split funding entities into three groups:
1. **Non-Regional Group**: 0% regionally-dominated ads (likely national interest groups).
2. **Regional Group**: ≥99% regionally-dominated ads (local issues or specific state races).
3. **Partially-Regional Group**: A mix of both (strategic heavyweights like presidential campaigns).
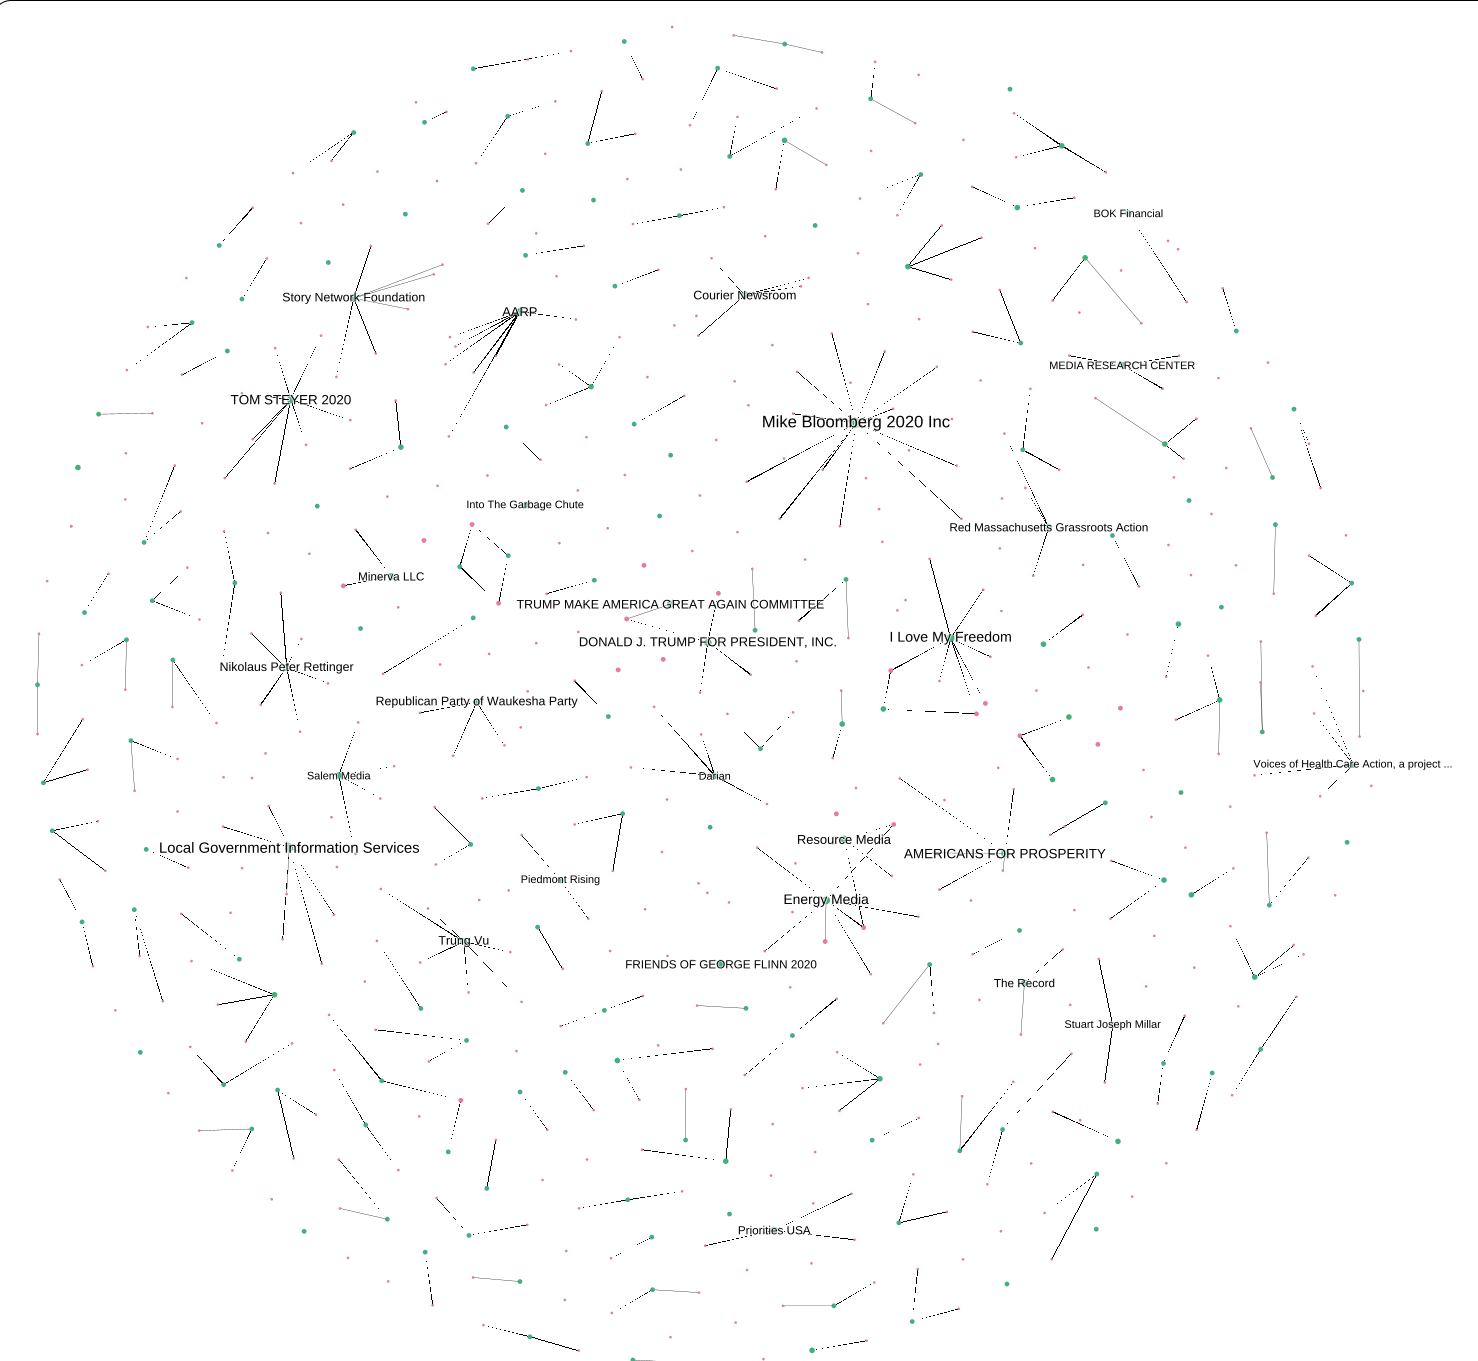
*Figure 1: Bipartite network connecting sponsors to the disparate Facebook pages they manage, revealing the complexity of online presence.*
## Insights from the Network: Campaigns vs. Interest Groups
The study used bipartite networks to link entities to the **Creative Link Captions** (the URLs attached to ads). This revealed a massive disparity in behavior:
- **Interest Groups** dominate the "Non-Regional" group. They favor national dispersion and often obscure their donor lists.
- **Campaigns** dominate the "Partially-Regional" group. These are the "power users" who outspend all others, using regional ads for specific events (like the Iowa caucus) and non-regional ads for general fundraising.
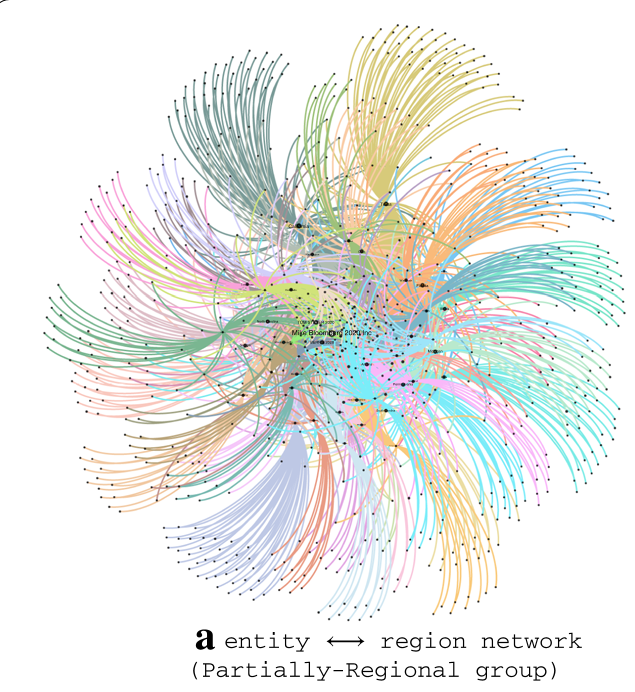
*Figure 2: Comparison of regional networks. The Regional group shows a fragmented, modular structure, while the Partially-Regional group is a dense, high-spend ecosystem.*
## Content Strategy: The Iowa Factor
One of the most compelling findings involves **Ad Text Recycling**. The authors found that presidential campaigns (like Andrew Yang's, used as a case study) create "flowers" of ad IDs around a single text.
- **"Red Flowers"**: Ad texts only used in one region (e.g., "See you at the Iowa caucus!").
- **"Blue/Mixed Flowers"**: Ad texts used nationally or across a mix of types, almost always centered on **fundraising** (e.g., linking to ActBlue or WinRed).
## Critical Analysis: The Future of Transparency
**Takeaway**: This research successfully "labels the unlabelled." By understanding how certain geographic patterns correlate with disclosure types (or lack thereof), we can begin to automate the identification of shadowy funding entities.
**Limitations**: The study relies on "string equality" for text analysis, meaning a single typo makes two ads appear different. Furthermore, it treats the Facebook "algorithm's choice" of who sees an ad as the same as the "advertiser's intent," which may not always align due to platform-side demographic biases.
**Future Perspective**: The next step in this research is using these geographic "fingerprints" to predict the donor status of unlabelled entities, providing a vital tool for journalists and regulators to monitor the 2026 and 2028 election cycles.