
The GEO-P Model: Deciphering the Latent Geometry of Social Networks
The Geometric Protean Model for On-Line Social Networks
The paper introduces the Geometric Protean (GEO-P) model, a novel stochastic framework for On-Line Social Networks (OSNs) that combines Euclidean embedding with rank-based connectivity. It achieves SOTA alignment with empirical OSN properties, including power-law degree distributions and bad spectral expansion, while introducing a methodology to estimate the "hidden dimension" of social networks.
TL;DR
Researchers have long sought a mathematical model that perfectly mirrors the chaos of online social networks (OSNs). The Geo-Protean (GEO-P) model bridges the gap by blending geometry with social hierarchy. By embedding users into an -dimensional Euclidean space and link-building based on popularity ranks, the model successfully replicates power-law distributions, small-world properties, and—crucially—the "bad spectral expansion" unique to human social structures.
Background: Why Social Networks are Special
In the world of graph theory, not all networks are created equal. While the Web graph (hyperlinks) and biological networks often exhibit "good expansion" (they are easy to traverse and hard to partition), social networks are "bad expanders." They are composed of tightly-knit communities where people within a group are highly connected, but links between different groups are sparse.
The authors argue that this structure arises because we occupy a Social Space. Your "coordinate" in this space is determined by your attributes: geography, age, occupation, and hobbies. Use proximity in this space, combined with a ranking of "popularity," and you can model the evolution of Facebook or Twitter with startling accuracy.
Methodology: Rank Meets Geometry
The GEO-P model functions as an ergodic Markov chain with four key parameters: (attachment strength), (density), (dimension), and (link probability).
1. The Geometry
Nodes are points in a unit hypercube . The distance between users is measured using a torus metric (to avoid boundary effects). This represents the "social distance."
2. The Influence Region
Every node has an "influence region" . The higher your rank (where rank 1 is the most popular), the larger your influence. The volume is defined as: When a new node is born, it connects to existing nodes if it falls within their influence regions.
(Note: The figure would illustrate how higher-ranked nodes cover more volume in the hypercube, attracting more connections from new points.)
Mathematical Triumphs: Power Laws and Densification
The paper rigorously proves several emergent properties:
- Power Law: The degree distribution follows .
- Densification: Unlike static graphs, OSNs get denser over time. The average degree grows as .
- Spectral Gap: The model proves a spectral gap , reflecting the "cluster-heavy" nature of social networks.
Reverse Engineering the Social Dimension
One of the most exciting aspects of this research is the formula for Dimension (). By taking known statistics from real-world OSNs—specifically the order (), power-law exponent (), average degree (), and diameter ()—we can calculate the underlying dimensionality of that social network.
Empirical Results:
| Network | Order () | Power Law () | Predicted Dim () |
|---|---|---|---|
| 2.4 | 5 | ||
| Flickr | 2.78 | 4 | |
| YouTube | 2.99 | 6 | |
| Cyworld | 5.0 | 7 |
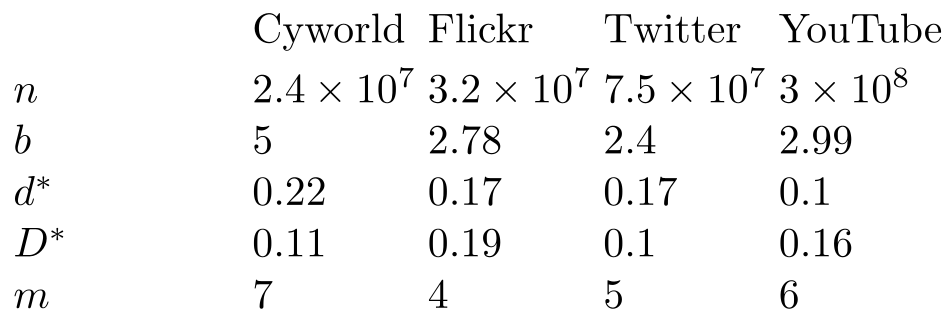
The results suggest that human social structures can be mapped into a relatively small number of dimensions (4 to 7). This implies that a handful of key attributes are sufficient to characterize our social connectivity.
Critical Insight & Conclusion
The GEO-P model suggests that the Logarithmic Dimension Hypothesis (LDH) holds true: the dimension of an OSN is likely .
Takeaway for Practitioners: If you are building recommendation engines or community detection algorithms, the GEO-P model provides a theoretical justification for low-dimensional embeddings. It tells us that social links are not random; they are manifestations of a hidden geometric reality.
Limitations: While the model is robust, it assumes a torus metric which might not capture the hierarchical or non-Euclidean nature of some social interactions (e.g., hyperbolic geometry). Future work should explore if these "social dimensions" remain stable as the network grows billion-fold.