
Measuring the Pulse of Digital Health: Can Economics Save Online Support Groups?
Employing the Gini coefficient to measure participation inequality in treatment-focused Digital Health Social Networks
This study investigates whether the Gini coefficient, an econometric measure of statistical dispersion, can quantify participation inequality in Digital Health Social Networks (DHSNs). By analyzing longitudinal data from four long-standing networks (alcohol, smoking, depression, and panic), the authors demonstrate that while the Gini coefficient effectively tracks shifts in inequality over time, its relationship with network size and volume varies significantly across different therapeutic domains.
Executive Summary
TL;DR: This research repurposes the Gini coefficient—an economic tool for tracking wealth distribution—to measure "participation inequality" in Digital Health Social Networks (DHSNs). By analyzing nearly 19,000 days of data, the study reveals that while inequality is inherent to social networks, the way it shifts depends heavily on whether the community focuses on addiction or mental health.
Positioning: This work bridges the gap between econometrics and digital health management, moving beyond simple "vanity metrics" (like total post counts) toward sophisticated structural health indicators.
The Problem: The Hidden Imbalance
Digital health groups often follow a "power law": a tiny minority of "Superusers" generates the vast majority of content. While these superusers provide critical support, excessive inequality can lead to community fragile-ness or "echo chambers."
The problem for community managers has been the lack of a simple, mathematically rigorous way to track these shifts over time. How do you know if a reach-out campaign actually improved engagement across the board, or just made the "vocal 1%" even louder?
Methodology: From Income to Influence
The authors utilized the Lorenz Curve and the Gini Coefficient as their primary instruments.
- The Logic: In an equal "economy" of posts, every user would contribute exactly the same amount (Gini = 0). In a maximum-inequality scenario, one person does everything (Gini = 1).
- The Data: The study looked at 222 quarters of data from four major platforms:
- AlcoholHelpCenter.net
- DepressionCenter.net
- PanicCenter.net
- StopSmokingCenter.net
 Figure 1: Conceptual overview of Gini and DHSN participation.
Key Insights: Addiction vs. Mental Health
The most striking finding was the divergence in behavior patterns based on the therapeutic focus.
1. The Productivity Paradox
Across all groups, more posts generally meant a higher Gini coefficient. This implies that high activity is often driven by a small group of highly active members getting even more active, rather than a broad-based surge in participation.
2. The Scaling Divergence
- Addiction Networks (Alcohol/Smoking): As more people joined, inequality increased. These groups thrive on a "hub-and-spoke" model where experienced members offer quick, situational advice to newcomers facing cravings.
- Mental Health Networks (Depression/Panic): Interestingly, the regression models showed that as these networks grew, inequality tended to decrease.
The "Why": The authors suggest this is due to the nature of Cognitive Behavioral Therapy (CBT) used in mental health groups. CBT requires long-term "homework," journaling, and self-reflection, leading to more sustained, equalized engagement from all members compared to the "short-burst" support seen in addiction recovery.
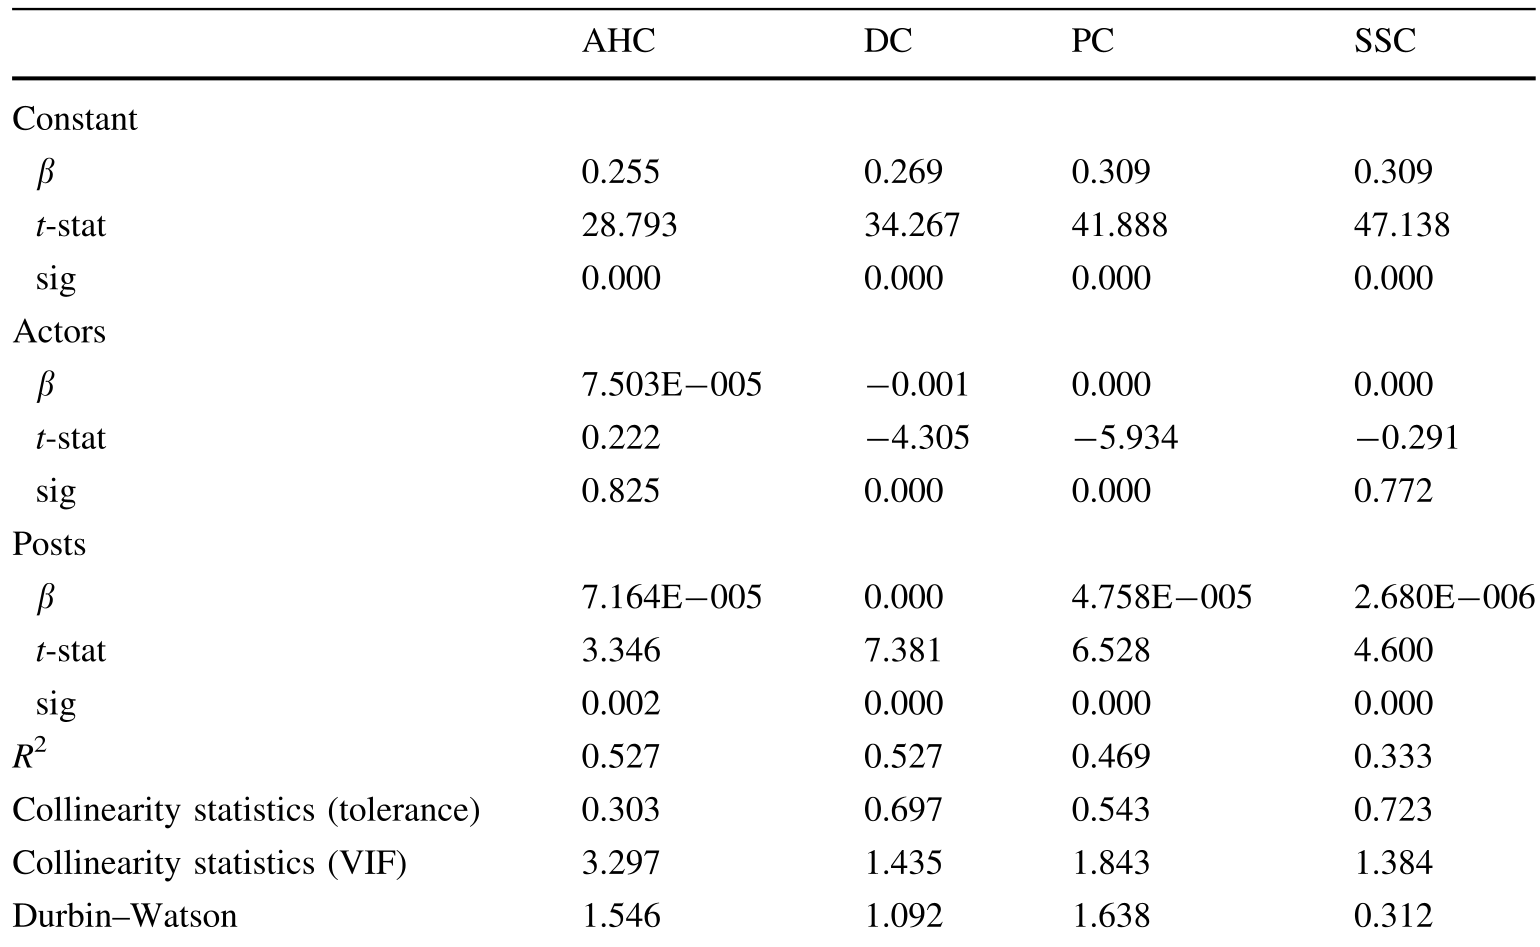 Table 2: Multiple regression results showing the diverging impact of 'Actors' on inequality.
Critical Analysis & Conclusion
While the Gini coefficient is a powerful diagnostic tool, the authors warn that it isn't a "magic number." A Gini of 0.33 might look the same on paper for a small group or a massive one, but the community dynamics are vastly different.
The Takeaway for Platform Managers:
- Visual Monitoring: Gini-over-time graphs (like the one below) can help moderators see the immediate impact of policy changes or technical outages on community health.
- Design for Therapy: If you are building a mental health platform, focus on features that promote "peer-to-peer" equality. If it's addiction recovery, prepare to support and cultivate your "Superusers," as they are the primary engine of the network.
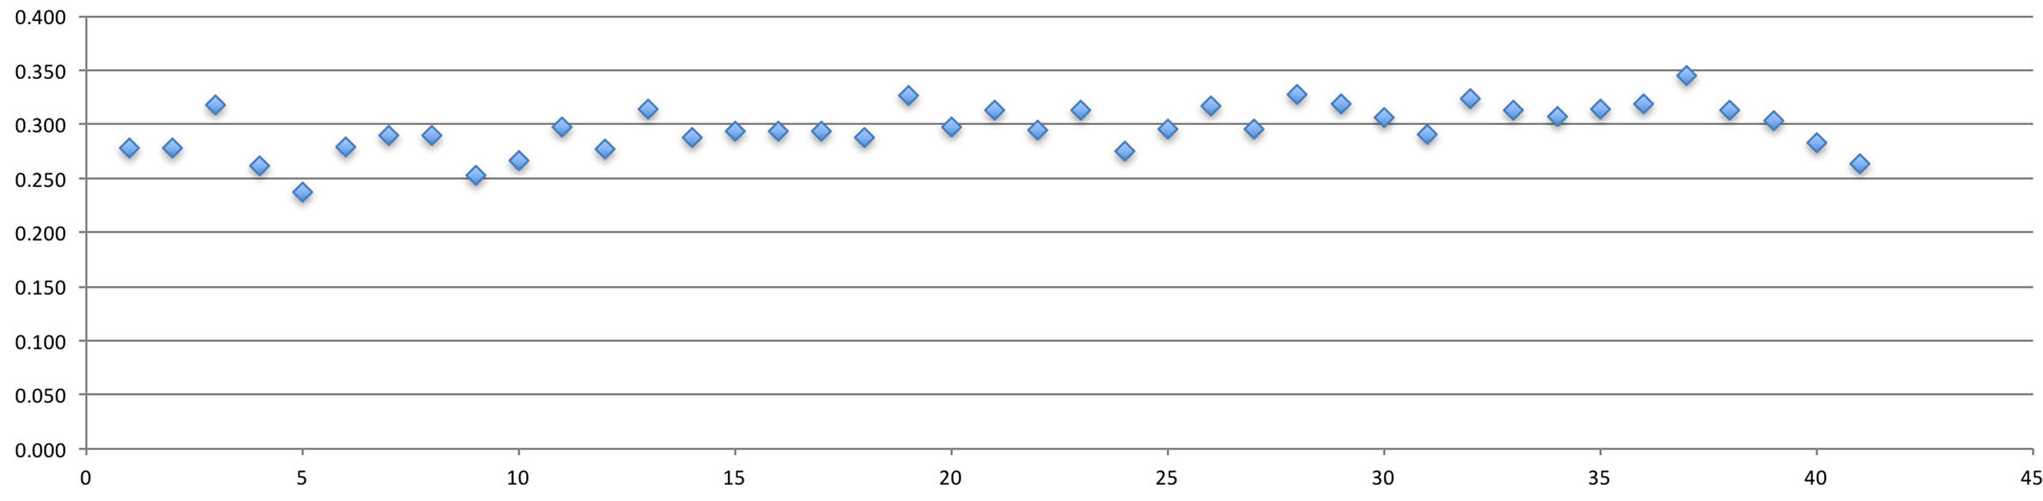 Figure 3: Longitudinal tracking of participation inequality (AHC).
Limitations: The study uses self-selecting populations (people actively seeking help), meaning these metrics might look different in "mandatory" health programs or general wellness apps.
Future Work: The next frontier is defining "optimal inequality." Is there a "Goldilocks" Gini score where a network is both highly active and safely distributed? This study provides the yard stick; now we need to find the ideal measurement.