
Globalization of Collaborative Creativity: Mapping 20 Years of Patent Networks
Globalization of collaborative creativity through cross-border patent activities
This study utilizes patentometrics and social network analysis (SNA) to investigate global collaborative creativity through USPTO utility patents from 1990 to 2009. It reveals a linear growth in cross-border patents and an exponential surge in the number of international inventors, achieving a denser, globalized innovation network led by a core group of countries.
TL;DR
Is technical creativity becoming truly global, or is it still locked in traditional powerhouses? This study analyzes 2,749,651 USPTO patents over two decades (1990–2009) to reveal that while cross-border patents are growing linearly, the human capital—the inventors—is expanding exponentially. The resulting network is denser and increasingly influenced by Asian hubs, proving that geography, rather than language, is the primary driver of technical collaboration.
Background: Beyond Scientific Papers
For years, "collaboration" in academia was measured by co-authored papers. However, scientific papers and technical patents represent different stages of the innovation cycle. This paper argues that patents are the ultimate output of technical creativity.
The authors tackle a persistent challenge: how to measure global collaboration without letting the "Home Advantage" (the fact that the U.S. and Canada dominate the USPTO) skew the results. Their solution is a rigorous application of Social Network Analysis (SNA) combined with Cosine Normalization.
Methodology: The Social Network of Innovation
The researchers treated countries as "nodes" and cross-border collaborative patents as "links."
Key Metrics Used:
- k-Core Analysis: Identifying sub-graphs where every country is connected to at least k other countries. It identifies the "inner circle" of global innovation.
- Betweenness Centrality: Measuring a country's role as a "bridge" or gatekeeper between other nations.
- Cosine Normalization: Reducing the impact of absolute patent volume to see the relative strength of international ties.

Deep Dive: Linear Patents vs. Exponential Inventors
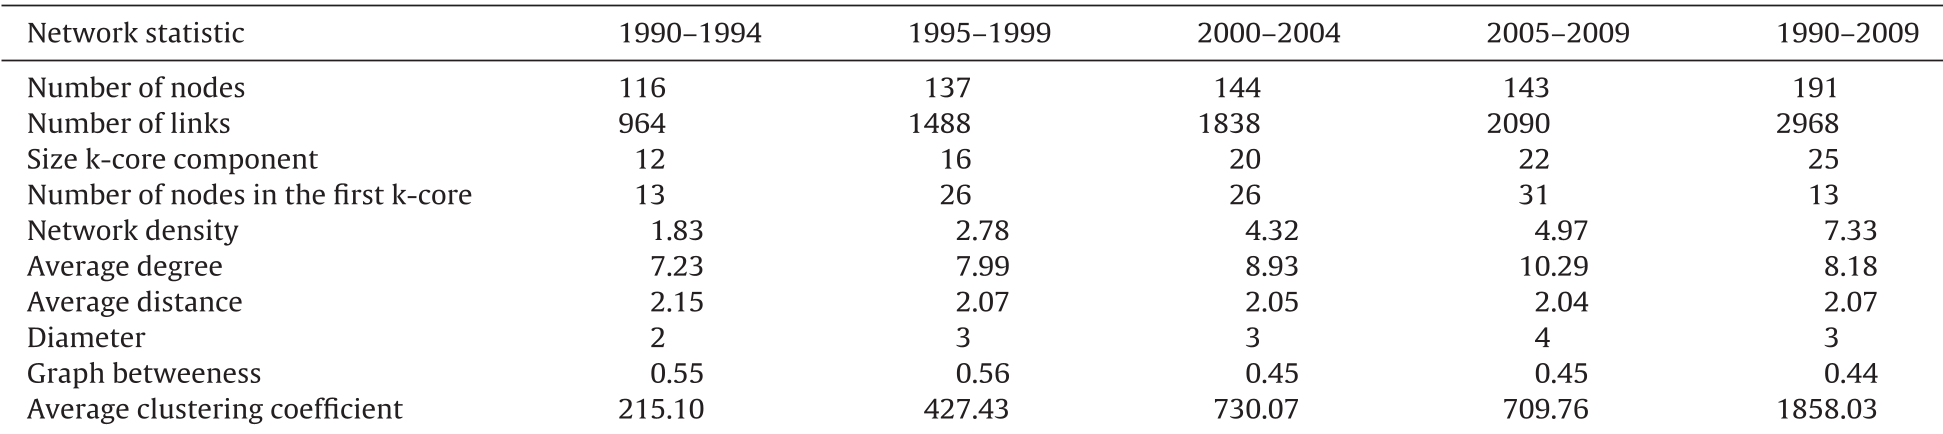
The most striking discovery is the divergence between patent counts and inventor counts. While cross-border patents grew nearly 4x, the number of inventors exploded. This suggests that modern technical problems have become so complex that they require larger, more diverse teams of specialists.
- Average inventors per patent: Rose from 3.47 (1990-1994) to 4.21 (2005-2009).
- Network Connectivity: The "Diameter" of the network increased, while the "Average Distance" decreased, indicating a "Small World" effect where global innovators are more closely linked than ever.
Geographical Proximity > Shared Language
A common assumption is that countries sharing a language (e.g., the Anglosphere) collaborate more. This study refutes that for technology. The k-core distribution shows clusters forming around geographic regions:
- The European Core: Spreading from Central Europe to Eastern and Southern Europe.
- The Asian Rise: Lead by Japan and Australia, with India and Singapore quickly gaining "Betweenness" importance in the final 5-year interval.
- The North American Hub: Primarily the U.S. and Canada, maintaining the strongest centrality but seeing a gradual decline in relative dominance.
Critical Insight: The "Saturation" of the Core
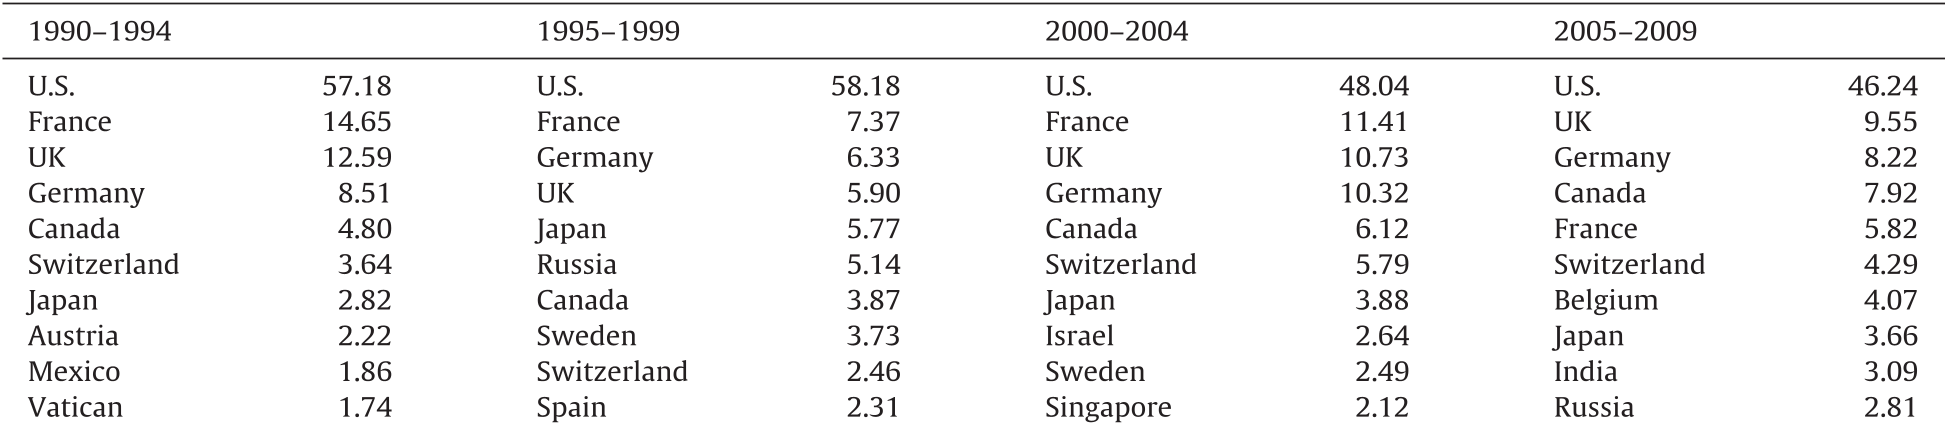
After applying Cosine Normalization, the authors found that the core of the global creativity network is reaching a "saturated" state. The "Big Players" (U.S., UK, Germany, Japan) are so tightly interconnected that the most significant growth is now happening at the periphery.
As the betweenness centrality of the U.S. dropped from 57.18% to 46.24%, it opened doors for "bridge countries" like India and Singapore to play more critical roles in the global flow of ideas.
Conclusion & Future Outlook
The globalization of collaborative creativity is an undeniable trend, but it is not a "flat world." It is a world of clusters determined by geography.
- Key Takeaway: To innovate today, firms must look to "periphery" hubs that are currently integrating into the primary k-cores.
- Limitations: The study relies solely on USPTO data. Incorporating EPO (Europe) and JPO (Japan) data might reveal even more localized clusters.
This research provides a foundational map for understanding how technical knowledge bypasses borders, reminding us that in the age of digital communication, physical proximity still dictates who we create with.