
FDBBP: Unmasking Joint Healthcare Fraud via Behavioral Trajectory Graphs
A Graph-Based Method for Health Care Joint Fraud Detection
The paper introduces FDBBP (Fraud Detection Based on Behavior Patterns), a graph-based framework designed to identify joint healthcare fraud. It transforms heterogeneous medical data into a weighted homogeneous patient network and utilizes the Louvain algorithm combined with local clustering coefficients to detect suspicious groups and elite fraudsters.
TL;DR
Healthcare fraud is shifting from individual "lone wolf" anomalies to sophisticated joint fraud (collusion). This paper presents FDBBP, a method that stops looking at what a patient spends and starts looking at where and when they move. By mapping patients into a similarity graph and using community detection (Louvain) paired with clustering coefficients, the authors achieved an 88% recall rate in identifying fraud rings.
The Shift from Outlier to Collusion
Most anti-fraud systems are built to catch "outliers"—the patient who buys 100 boxes of insulin in a day. However, modern fraudsters operate in groups, using multiple stolen or borrowed insurance cards to conduct "fake treatments" at specific, often compromised, clinics.
The problem? These individual records look perfectly normal. The anomaly only appears when you look at the connections. Prior work using rule-based engines or standard ML (like Random Forest) fails here because it lacks the topological context of these relationships.
Methodology: Mapping the Medical "Fingerprint"
The core insight of the paper is that fraudsters carrying multiple cards have a highly consistent medical trajectory. They visit the same hospital at the same time repeatedly.
1. Constructing the Trajectory Graph
Instead of a simple patient-doctor table, the authors build a heterogeneous network:
- Nodes: Patients, Events, Hospitals, Time.
- Edge Logic: If Patient A and Patient B share the same hospital node at the same time node, their "Behavior Repeatability" score increases.
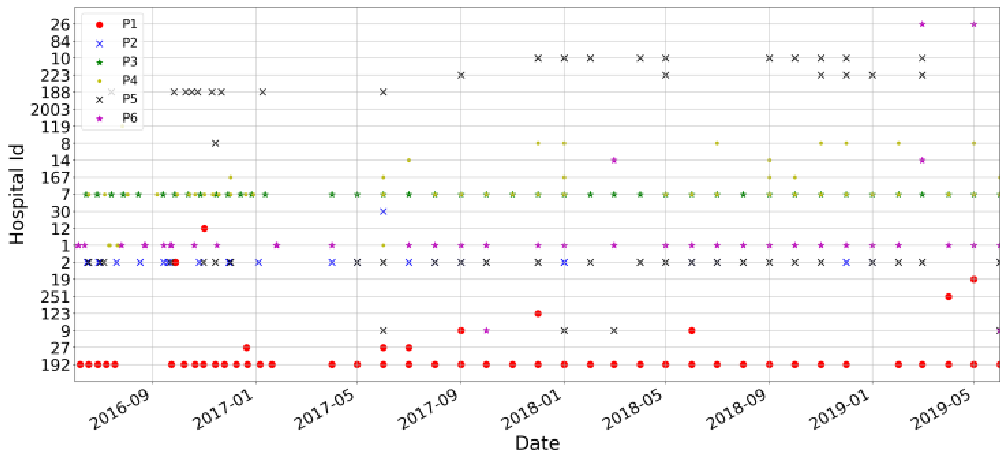 In the figure above, normal patients (left) show scattered, random trajectories, while fraud groups (right) show nearly identical paths.
2. Community Detection vs. Clustering Coefficient
Once the similarity matrix is built, the authors apply the Louvain Algorithm. Louvain is excellent at maximizing "Modularity"—finding groups that are more connected to each other than to the rest of the world.
However, big communities often contain "innocent bystanders." To solve this, the authors use the Local Clustering Coefficient (CC).
- Intuition: In a fraud ring, "my friends are also friends with each other." A high CC indicates a clique where everyone is linked by suspicious behavior, whereas a low CC in a large community suggests accidental similarity.
 The process moves from a raw healthcare network to a simplified patient-only graph.
Performance Benchmarks
The FDBBP method was tested against industry standards like Lightgbm and Isolation Forest (IForest).
| Method | Precision | Recall | F-Score |
|---|---|---|---|
| Lightgbm | 0.3452 | 0.5249 | 0.4164 |
| IForest | 0.8327 | 0.2573 | 0.3931 |
| FDBBP | 0.8283 | 0.8809 | 0.8537 |
While IForest has decent precision, its Recall is abysmal (25%). This confirms the authors' hypothesis: global anomaly detection is blind to local group behavior. FDBBP nearly triples the recall, catching the vast majority of suspected fraudsters.
Critical Insight: The "Threshold" Trade-off
A key takeaway from the experiments is the sensitivity to the Relationship Threshold. If the threshold is too low, the graph is a "giant component" (everyone looks like a fraudster). If it's too high, the graph shatters into isolated nodes. The authors suggest setting the threshold slightly higher than a known fraud sample ratio to maximize the "check space" for auditors.
Conclusion & Future Directions
FDBBP proves that for healthcare fraud, topology is destiny. By shifting from feature-engineering (age, cost, etc.) to graph-engineering (trajectories, communities), we can unmask collusion that was previously invisible.
Future Work: The authors aim to introduce Attention Mechanisms to weight different types of behaviors (e.g., sharing a rare diagnosis should weigh more than sharing a common hospital) to further refine the similarity matrix.