
Mapping Brand Risks: A Graph-Based Approach to Negative e-WOM Influence
Graph-based Model for Negative e-WOM Influence in Social Media
The paper introduces a multi-step computational framework named the "Influence Graph" model to detect and analyze the impact of negative electronic Word-of-Mouth (e-WOM). It combines Random Forest classification, sense2vec-based similarity clustering, and graph theory to visualize and quantify how negative customer feedback spreads across social media platforms like Twitter.
TL;DR
In the age of viral social media, a single negative review can spiral into a public relations crisis. This paper presents a systematic framework to track Negative electronic Word-of-Mouth (e-WOM) by converting tweets into "Influence Graphs." By combining Machine Learning (Random Forest) with Graph Theory, the authors identify not just what is being said, but who is driving the narrative and which topics pose the greatest cumulative risk to a company's reputation.
The Motivation: Moving Beyond Simple Polarity
While sentiment analysis (classifying text as positive or negative) is a solved problem in many respects, it lacks contextual depth. For a brand manager, knowing that 1,000 people are unhappy is less useful than knowing that 10 of those people are "hubs" in a social network whose complaints about "Lost Luggage" are currently influencing thousands of potential customers.
The authors argue that the missing link in prior research is the structural influence—the intersection of text similarity, time precedence (who complained first), and social ties (where they are located).
Methodology: From Raw Tweets to Influence Maps
The proposed pipeline consists of five rigorous steps designed to distill raw social noise into strategic insights:
1. Polarity Classification (The Random Forest Layer)
The researchers utilized a Random Forest classifier with 150 estimators to categorize tweets into Positive, Negative, or Neutral. On a dataset of U.S. Airline customers, they achieved an 80% accuracy rate, identifying that negative feedback often outweighs positive interactions in the airline service sector.
2. Semantic Clustering (sense2vec)
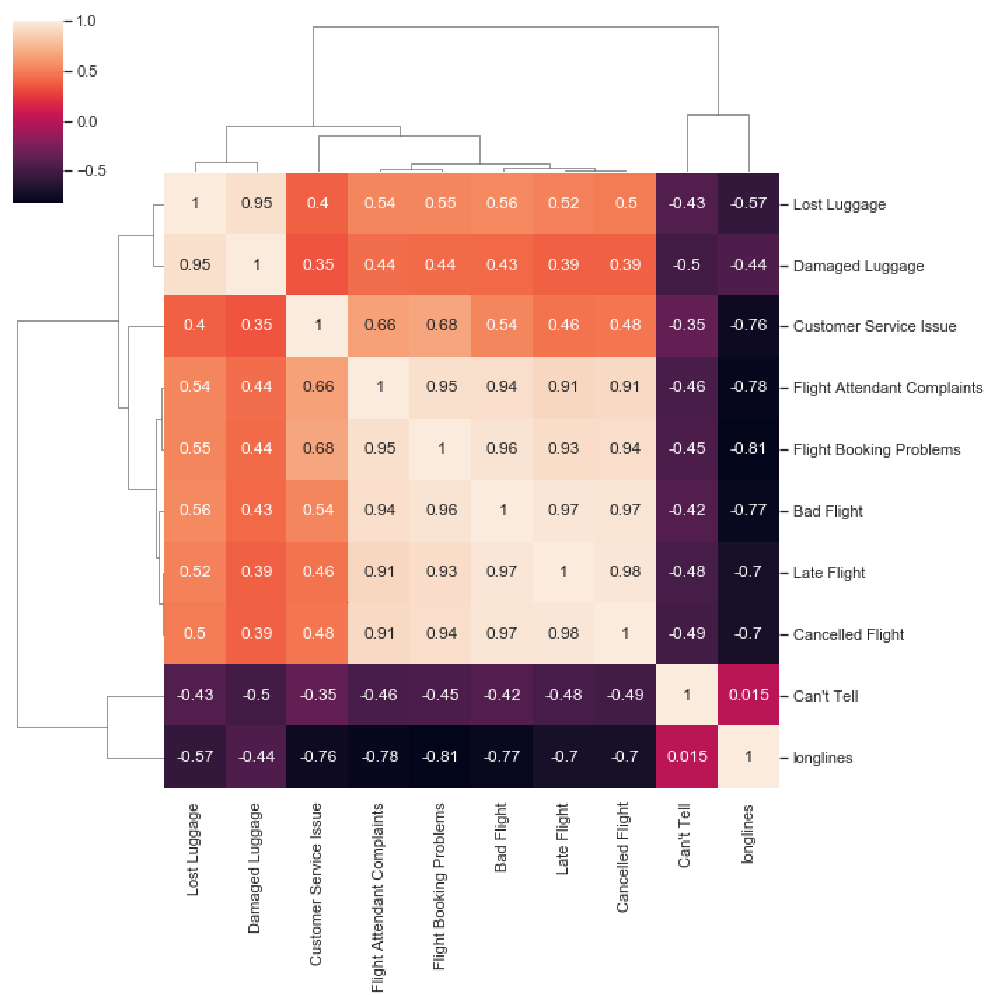
To handle the nuances of language, the model uses sense2vec to calculate the cosine similarity between topics. This allows the system to recognize that a complaint about "Damaged Luggage" is semantically linked to "Lost Luggage," thereby grouping them into a single risk cluster.
3. Constructing the Influence Graph
This is the core innovation. A directed graph is built where:
- Nodes (): Individual participants who posted negative e-WOM.
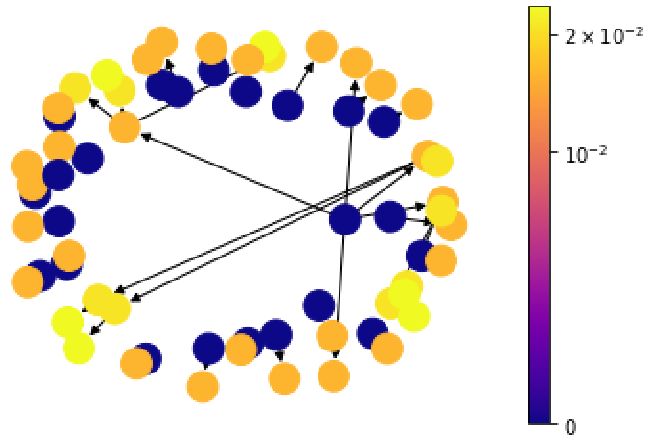
- Edges (): Created if two participants share a social tie (location), their complaints are semantically similar, and one precedes the other in time.
Experiments & Analysis: Identifying the "Risk Patterns"
Using the United Airlines dataset, the authors applied several graph metrics to evaluate the results:
- Out-Degree Centrality: Used to find the "Top Influencers." In one case, the model flagged a user who appeared highly influential; subsequent manual verification revealed the user had over 70,000 followers across Twitter and Instagram.
- Betweenness Centrality: Identified the "Bridges"—users who connect different clusters of dissatisfied customers. Influencing these users can effectively "break" the chain of negative spread.
- Closeness Centrality: Determined how quickly a negative opinion could reach the entire network.
Critical Analysis & Conclusion
The power of this research lies in its scalability. By migrating from simple list-based data to graph structures, the framework enables the use of distributed computing to handle millions of nodes.
Key Takeaway
For modern SMM (Social Media Marketing), it is no longer enough to be reactive. This graph-based approach allows companies to:
- Prioritize High-Risk Users: Focus customer service efforts on nodes with high Out-Degree.
- Detect Trend Clusters: Identify which service failures (e.g., "Late Flights") are creating the most significant social "echo chambers."
Limitations & Future Work
While the study uses geolocation as a proxy for social ties, future iterations could integrate direct "Follower/Friend" metadata for higher precision. The authors also suggest expanding the model to Viral Marketing, using similar graph structures to identify "seed nodes" for positive word-of-mouth campaigns or even political voter outreach.