
Beyond Node Counts: Leveraging Betweenness Centrality for Social Media Anomaly Detection
Analyzing the effectiveness of graph metrics for anomaly detection in online social networks
The paper proposes a semi-supervised framework for anomaly detection in Online Social Networks (OSNs) by modeling users as graph nodes and analyzing local structural properties. It introduces Average Betweenness Centrality (ABC) and Community Cohesiveness as key metrics, achieving superior performance over the SOTA "OddBall" algorithm, notably reaching a 100% F-score on the Facebook dataset using ABC relationships.
TL;DR
Researchers have developed a new framework for spotting "weird" behavior in social networks like Facebook and Flickr. By looking at Average Betweenness Centrality (ABC)—a measure of how often a person acts as a bridge between their friends—the framework can identify anomalous accounts (like bots or attackers) with significantly higher accuracy than existing industry-standard methods.
Background Positioning
In the landscape of graph mining, identifying outliers usually falls into two camps: Behavioral (what you do) and Structural (who you know). This paper is a significant refinement of structural analysis. While the famous OddBall algorithm (PAKDD 2010) set the stage by looking at the density of "egonets," this work argues that density isn't enough. It's not just about how many friends you have, but the topology of how those friends connect to each other.
The Core Insight: The "Friend-of-Friend" Rule
Most people in a social network follow a simple social heuristic: your friends are likely to be friends with each other. This creates a specific mathematical signature. Anomalous users—whether they are telemarketers, spammers, or data scrapers—usually break this rule. They tend to form:
- Star Patterns: One central node connected to many disconnected satellites.
- Cliques: Perfectly connected groups that look artificial.
Methodology: The Power of Average Betweenness Centrality (ABC)
The authors propose a 5-step framework, but the "secret sauce" lies in Definition 2: Average Betweenness Centrality.
Instead of just counting edges () and nodes (), they calculate the shortest paths within a user's immediate neighborhood (the egonet).
- Physical Intuition: If you are the only bridge between two groups of your friends, your betweenness is high. If your friends all know each other, your betweenness is low because they don't need you to reach each other.
- The Metric: .
 The formula for Average Betweenness Centrality used to score egonets.
They then use Power Law fitting () to find the "normal" line of behavior. Any node that drifts significantly from this curve is flagged with an Outlier Score.
Experimental Battle: ABC vs. OddBall
The researchers tested their theory against 20,000 egonets across Facebook, Orkut, and Flickr. The results were stark.
| Dataset | Method | F-Score |
|---|---|---|
| OddBall (N vs. E) | 65.77% | |
| E vs. ABC (Power Law) | 100.00% | |
| Orkut | OddBall (N vs. E) | 91.18% |
| Orkut | E vs. ABC (Linear) | 97.37% |
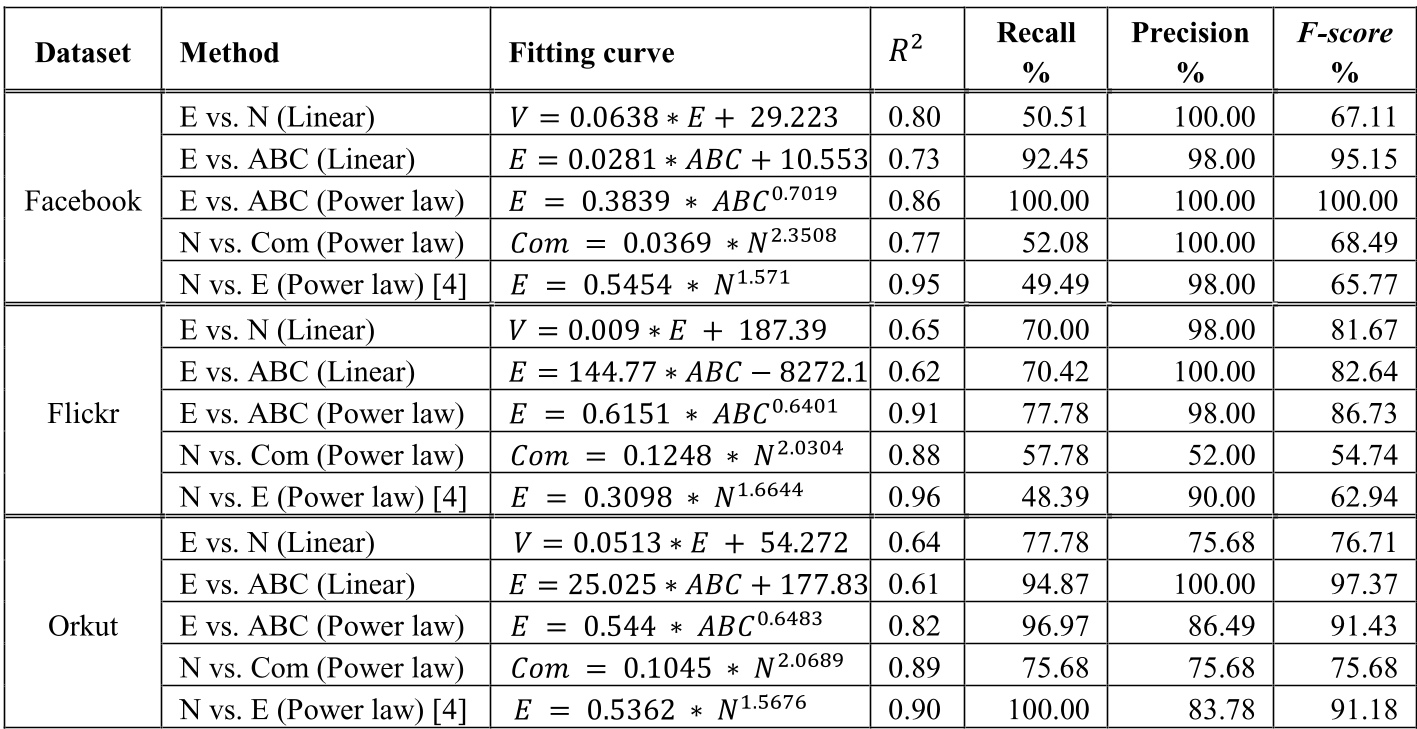 Table 1: Comparing F-scores across different graph metrics/datasets.
The data shows that the relationship between the number of edges and ABC is a much more stable and accurate predictor of "normalcy" than the relationship between nodes and edges. While OddBall struggled with dense graphs, the ABC-based approach maintained high precision because it captures the internal connectivity of the nodes.
Critical Analysis & Conclusion
Takeaway
The study proves that sophisticated graph metrics like Betweenness Centrality, though computationally more expensive than simple counting, provide a far more robust defense against attackers who try to mimic human behavior. Metadata—the "undeniable relationships"—is harder to fake than account profiles.
Limitations
- Scalability: Calculating Betweenness Centrality involves finding shortest paths, which is . In massive networks with billions of edges, this requires heavy optimization or sampling.
- Labeling: The study relied on manual visual inspection for labeling anomalies, which introduces human bias.
Future Outlook
As we move toward 2026, the battle against AI-generated bot networks will likely require these exact types of "Graph-AI" hybrids—combining structural metrics with deep learning to find the subtle architectural flaws in how bots build their social webs.