
Graph Summarization: Bridging the Gap Between Big Data and Human Intuition in Social Trends
Graph Summarization for Geo-correlated Trends Detection in Social Networks
This paper introduces a specialized graph summarization framework designed to assist data scientists in detecting geo-correlated trends within large-scale social networks. By transforming massive person-post graphs into condensed, multi-resolution summaries, the system enables human-driven trend inference across spatial and thematic dimensions.
TL;DR
Detecting trends in social networks is often hampered by the sheer scale of the data. This paper presents a framework that uses graph summarization to transform millions of social interactions into manageable, geo-correlated summaries. By introducing human-in-the-loop exploration through methods like locality partitioning and topic slicing, it empowers data scientists to "see" trends that rigid algorithmic models might miss.
Problem & Motivation: The "Too Much Data" Paradox
In the era of X (formerly Twitter) and Instagram, social networks are modeled as massive graphs where nodes are users/posts and edges are relationships/interactions. While we have automated models to detect "trending topics," these models are often pre-defined and rigid.
The researchers argue that data scientists need to be in the driver’s seat. However, a human cannot possibly inspect a graph with 10 million nodes. Traditional statistics (like mean degree) lose the structural context, while full visualization results in a "hairball" that is impossible to interpret. The challenge is: How do we shrink the graph without losing the geo-spatial and thematic essence of the trends?
Methodology: The Architecture of Abstraction
The authors propose a system that moves from raw data to human-readable summaries through four distinct methods.
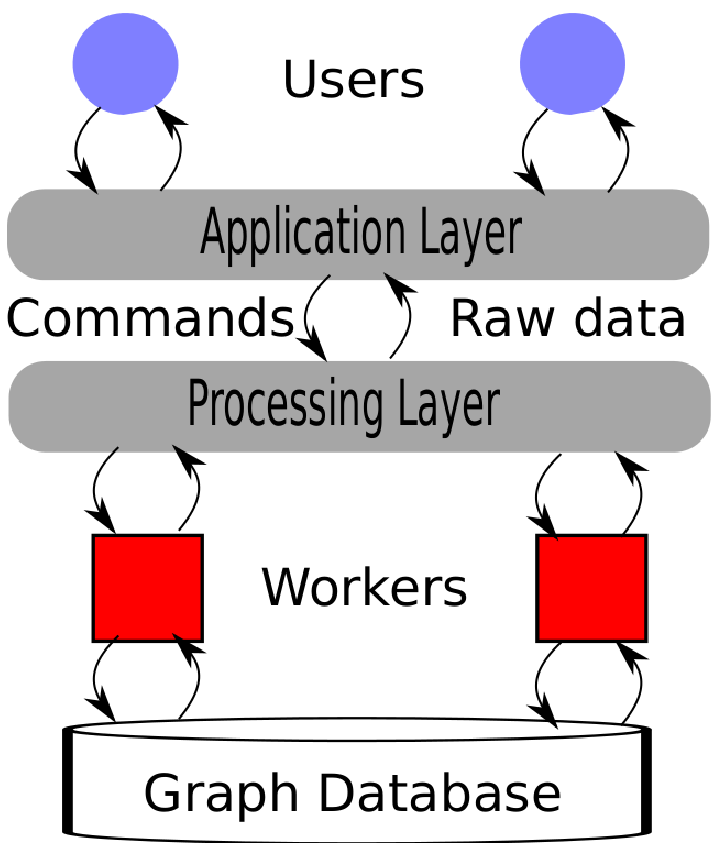
1. The System Architecture
The framework is built on a distributed processing layer that queries graph databases in parallel, allowing it to handle live streams of social media data.
2. Four Pillars of Summarization
The core "magic" happens through four transformation steps:
- Node Type Reduction: Instead of showing every tweet, the graph is collapsed into "Topic Nodes" (e.g., hashtags or sentiments).
- Frequency Display: Similar topic nodes are grouped. If 1,000 people in New York are tweeting about #AI, these are represented as a single node with a "weight" indicating frequency.
- Locality Display: Leveraging the First Law of Geography ("near things are more related than distant things"), the graph is partitioned by physical distance.
- Graph Slicing: To prevent thematic overlap from cluttering the view, the graph is sliced into subsets of related topics.
Experiments & Visual Evidence
The paper demonstrates that these transformations significantly simplify the visual workload. For instance, a complex web of interactions can be reduced to a handful of "Locality Nodes" that clearly show where specific topics are anchored geographically.
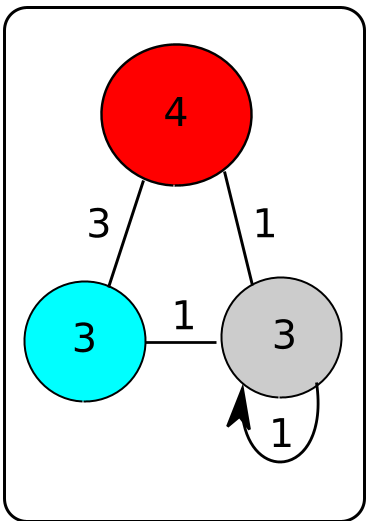 (Example showing the transition from individual topics to frequency and locality groupings)
By using "drill-down" (increasing detail) and "roll-up" (increasing abstraction) operations, a data scientist can start with a global view of a trend and zoom into a specific city to see the local nuances of the conversation.
Critical Analysis & Conclusion
The Takeaway
This work highlights that Graph Summarization is not just about compression—it's about semantic filtering. By focusing on the "Geo-correlated" aspect, the authors successfully apply the First Law of Geography to solve a modern data engineering problem.
Limitations & Future Work
While the framework provides a robust UI-driven approach, the paper leaves some questions open:
- Scalability Thresholds: How does the system perform when "Localities" overlap heavily in high-density urban areas?
- Dynamic Trends: Large social networks change by the second. Future versions of this work would benefit from "temporal slicing" to see how summaries evolve over minutes or hours.
Ultimately, this research serves as a vital bridge between the raw power of graph databases and the intuitive analytical capabilities of the human mind.