
Bridging the Gap: The Linear Hidden Logic Between Local Efficiency and Clustering Coefficients
A comprehensive comparison of graph theory metrics for social networks
The paper presents a comparative analysis of two critical social network metrics: Local Efficiency () and Clustering Coefficient (). Using both theoretical derivations for specific graph families and empirical fMRI data from athletes, the authors establish a robust linear approximation for non-sparse graphs.
TL;DR
While often used interchangeably in network science, Local Efficiency () and Clustering Coefficient () are mathematically distinct. This paper proves that for non-sparse graphs (where ), a startlingly simple linear relationship exist: . Through fMRI data and graph theory, the authors reveal that offers a more nuanced view of "friends-of-friends" connectivity that inherently ignores.
The Motivation: Are We Missing the "Friends-of-Friends"?
In the study of social and biological networks, connectivity is king. Traditionally, we use the Clustering Coefficient to measure "ego density"—if you have two friends, what is the probability they know each other?
However, the authors argue that this is too narrow. Consider Local Efficiency. While looks for a direct edge between your neighbors, evaluates how efficiently those neighbors can communicate if you were removed. If your friends aren't direct friends but share a mutual contact, captures that value; gives it a zero.
The research intuition here is that in real-world systems like the human brain, communication doesn't just stop because a direct link is missing—it reroutes.
Methodology: From fMRI Signals to Pure Math
The authors take a dual-track approach to prove the relationship between these metrics.
1. Theoretical Graph Families
The paper analyzes several "benchmark" graph structures to see how these metrics behave as the graphs grow or change density:
- Complete Multipartite Graphs: Used to model strictly partitioned communities.
- Wheel Graphs (): Modeling a central hub with a peripheral ring.
- Cycle Powers (): Modeling localized, neighborhood-heavy connectivity.
2. Physical Evidence: The Athlete's Brain
The authors examined fMRI data from collegiate football players. By calculating correlations between BOLD (Blood Oxygenated Level Dependent) signals across 92 brain regions, they constructed functional networks.
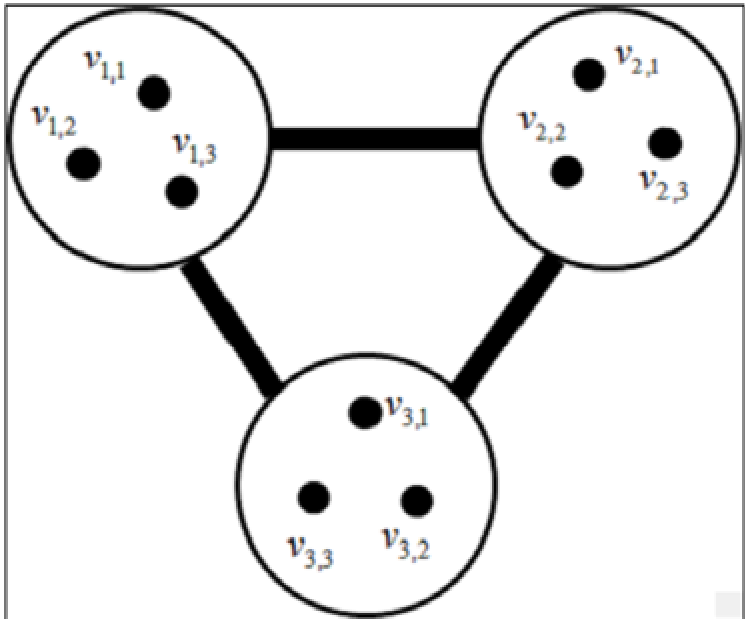 Figure 1: Example of community connectivity where metrics differ ().
The Core Finding: The "Half-Plus-Half" Rule
Across multiple proofs, the authors found a recurring pattern. For families like the Wheel Graph () and Cycle Powers (), the limit as the number of vertices approaches infinity reveals:
In the real-world athlete data, the average was . If the authors' theory was correct, the should be: The actual measured ? 0.82058. The precision is stunning, suggesting a fundamental property of non-sparse natural networks.
Experiments & Results: Validating the Correlation
To test the limits of this linear relationship, the authors ran 700 simulations using the Girvan-Newman benchmark (a Goldberg standard for community detection testing).
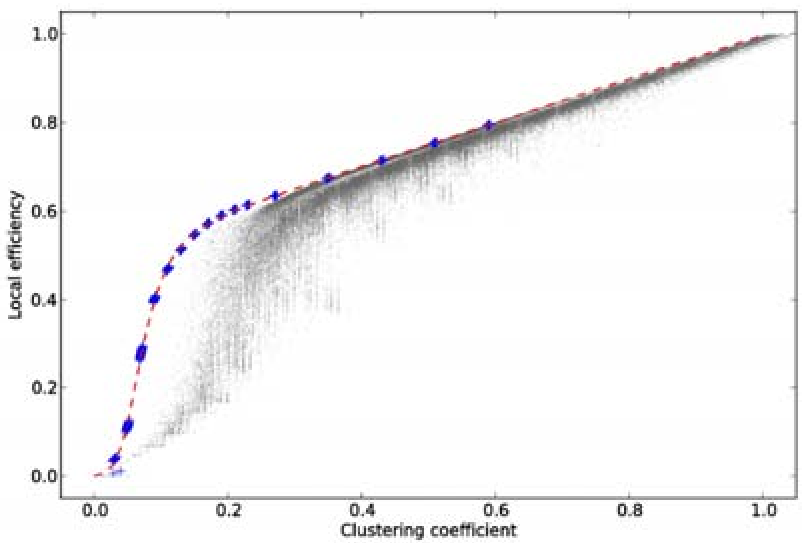 Figure 2: Plotting the linear trend between CC and Local Efficiency.
Key Stats:
- Correlation Strength: The best-fit line achieved an .
- The Divergence Point: The approximation holds best when the shortest path between any two vertices in a neighborhood does not exceed 2. When "long-range" local jumps occur, the metrics diverge further.
Critical Analysis & Conclusion
Takeaway
The study successfully deconstructs the assumption that and are redundant. While they are highly correlated, is systematically higher because it treats "indirect paths" as having partial efficiency, whereas treats them as non-existent.
Limitations
- Sparsity: The linear relationship breaks down in very sparse graphs (). In such cases, the local subgraphs don't have enough structure for the average efficiency to settle into a linear trend.
- Path Length: As noted in Section 3, the linear model deviates when local neighborhoods contain paths longer than 2 edges.
Future Perspectives
This identity provides a "shortcut" for researchers. In massive networks where calculating (which requires all-pairs shortest paths for every neighborhood) is computationally expensive, (which just counts triangles) can be used to estimate it with high reliability. This has immediate applications in real-time brain connectivity mapping and large-scale social graph analysis.