
From Patients to Networks: A New Framework for Deciphering Chronic Disease Progression
Adapting graph theory and social network measures on healthcare data: a new framework to understand chronic disease progression
This paper introduces a novel framework for analyzing chronic disease progression by adapting Graph Theory and Social Network Analysis (SNA) to hospital admission data. The authors utilize the hierarchical ICD-10 coding system to construct a "Baseline Network" and propose a Longitudinal Distance Matching method to assess individual patient risks for conditions like Type-2 Diabetes.
Executive Summary
TL;DR: This paper presents a pioneering shift in healthcare analytics, moving from isolated risk scores to a network-centric view of disease. By modeling hospital admissions as nodes and edges in a graph, the authors create a "Baseline Network" that maps the typical trajectory of chronic conditions like Type-2 Diabetes, allowing for personalized risk assessment through graph similarity matching.
Positioning: While published in 2016, this work serves as a foundational bridge between traditional medical informatics and modern Network Medicine. It moves beyond "What" a patient has to "How" their conditions evolve over time.
The Limitation of Static Scoring
For decades, clinical risk assessment has been dominated by indices like the Charlson Comorbidity Index. While useful for quick triage, these models are essentially "checklists" that ignore the temporal semantics of a patient's journey.
The authors argue that existing data mining methods often fail because:
- They ignore the time-gap between hospital visits.
- They do not capture the directional pattern (e.g., condition A leading to condition B).
- They lack the scalability to handle the thousands of unique codes (ICD-10) present in modern administrative data.
Methodology: The "Baseline Network" Approach
The core innovation lies in treating a patient's history not as a table, but as a sequence of states.
1. Constructing the Baseline
By scanning the 6-year history of 1,800 diabetic patients, the framework builds a master graph.
- Nodes: Represent ICD-10 diagnosis codes.
- Edges: Directed links denoting that one diagnosis followed another in subsequent admissions.
- Attributes: Edges carry "strength" (frequency) and "standard delay" (the average time elapsed between conditions).
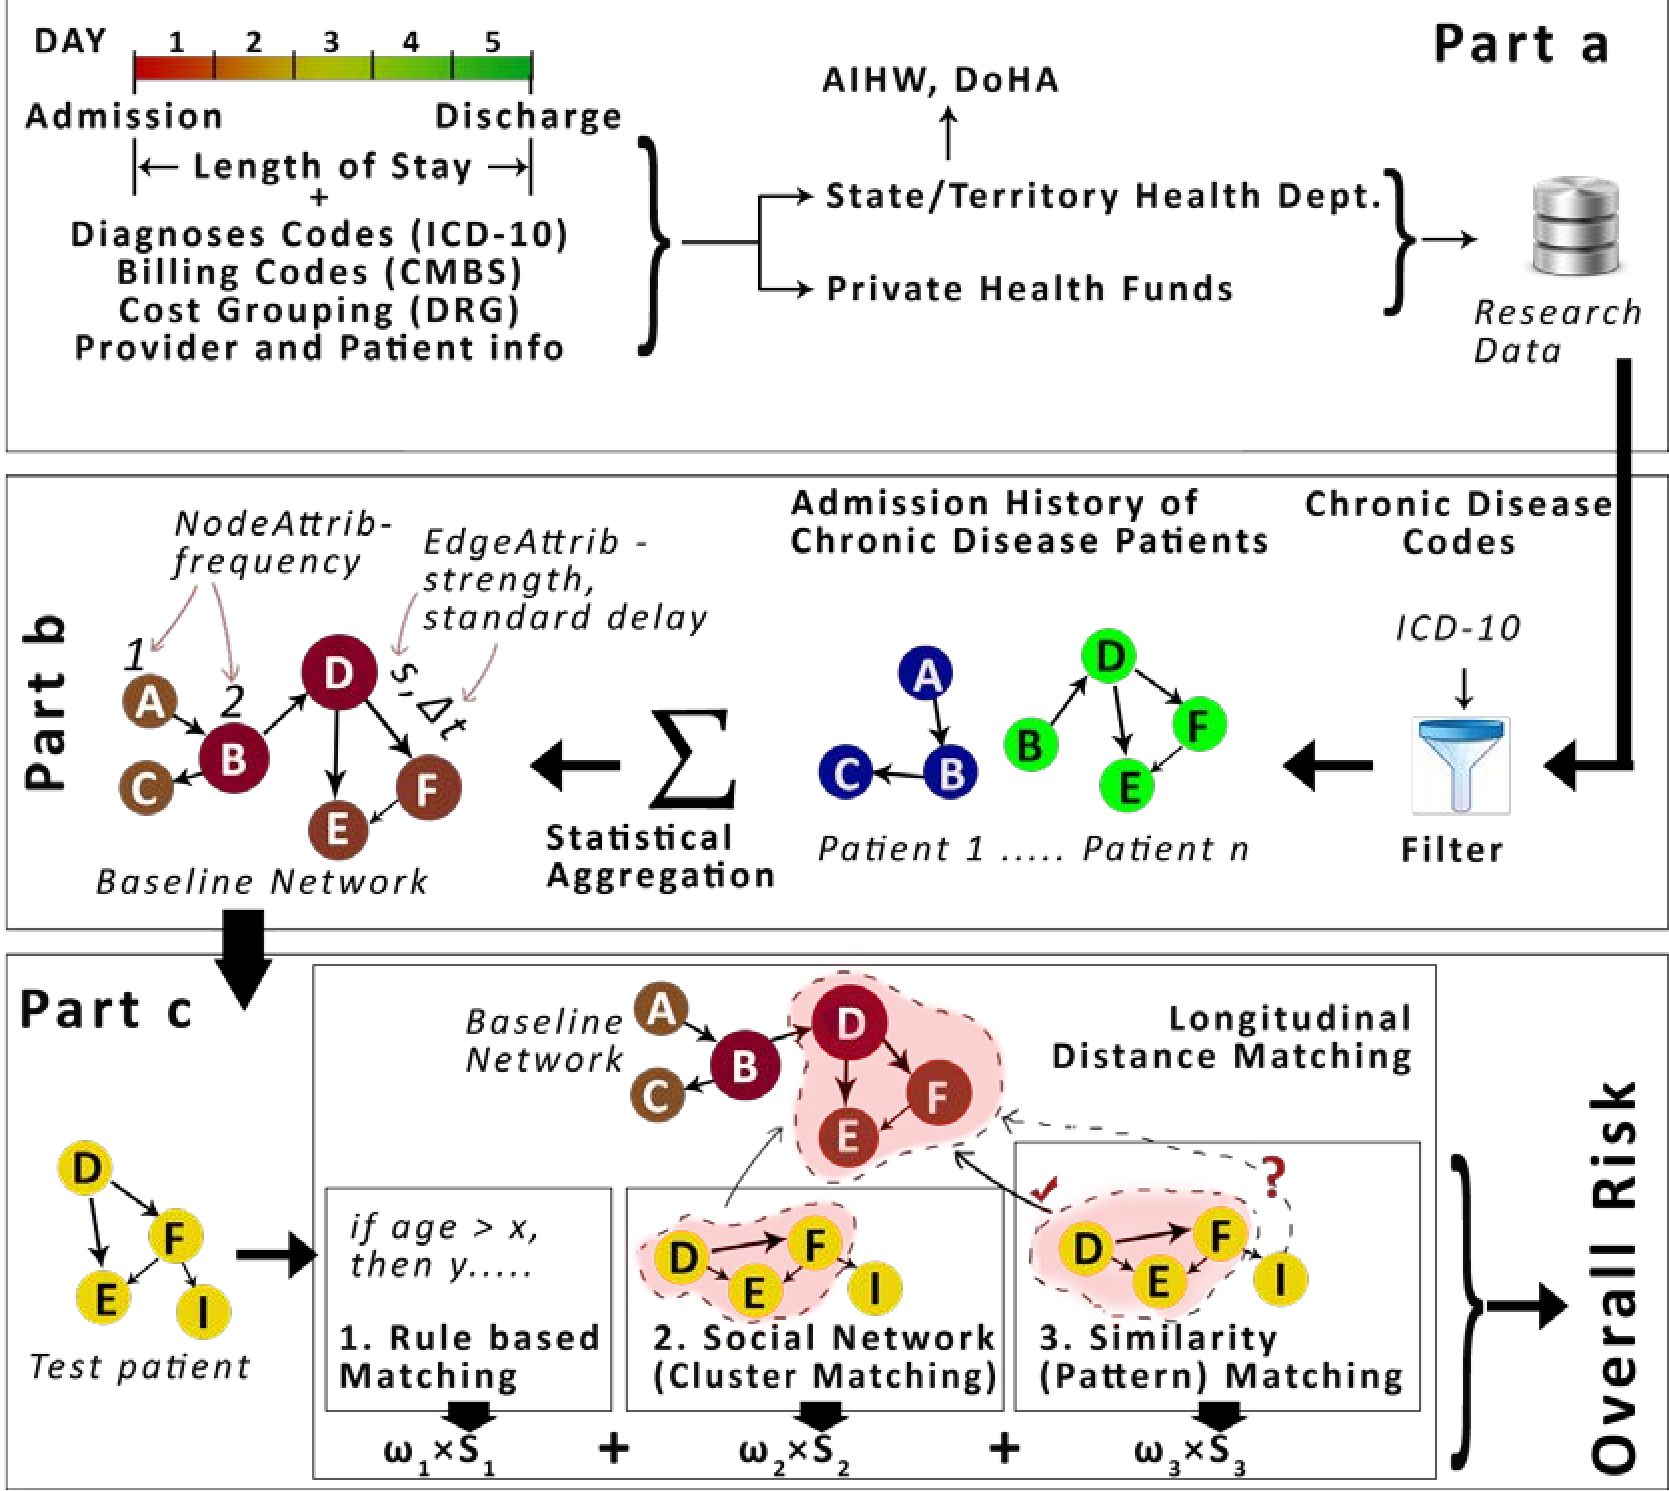 Figure 1: The three-part framework consisting of (a) Data Flow, (b) Network Creation, and (c) Risk Assessment via Longitudinal Distance Matching.
2. Longitudinal Distance Matching
To predict risk for a new patient, the framework uses "Longitudinal Distance Matching." This is effectively a Graph-to-Graph comparison. It answers: How much energy would it take to transform this new patient's small history graph into a segment of the diabetic Baseline Network?
The matching incorporates:
- Rule-based scores: Age and demographic risk.
- Cluster matching: Determining if the patient's symptoms fall into known "comorbidity communities."
- Graph Similarity: Using a metric similar to String Edit Distance to penalize missing nodes or incorrect temporal gaps.
Visualization of Disease Comorbidity
The authors utilized community detection algorithms to find "closely knitted" groups of diseases. Their analysis of Type-2 Diabetes revealed 7 distinct clusters, proving that chronic diseases do not occur in isolation but in synergistic "neighborhoods."
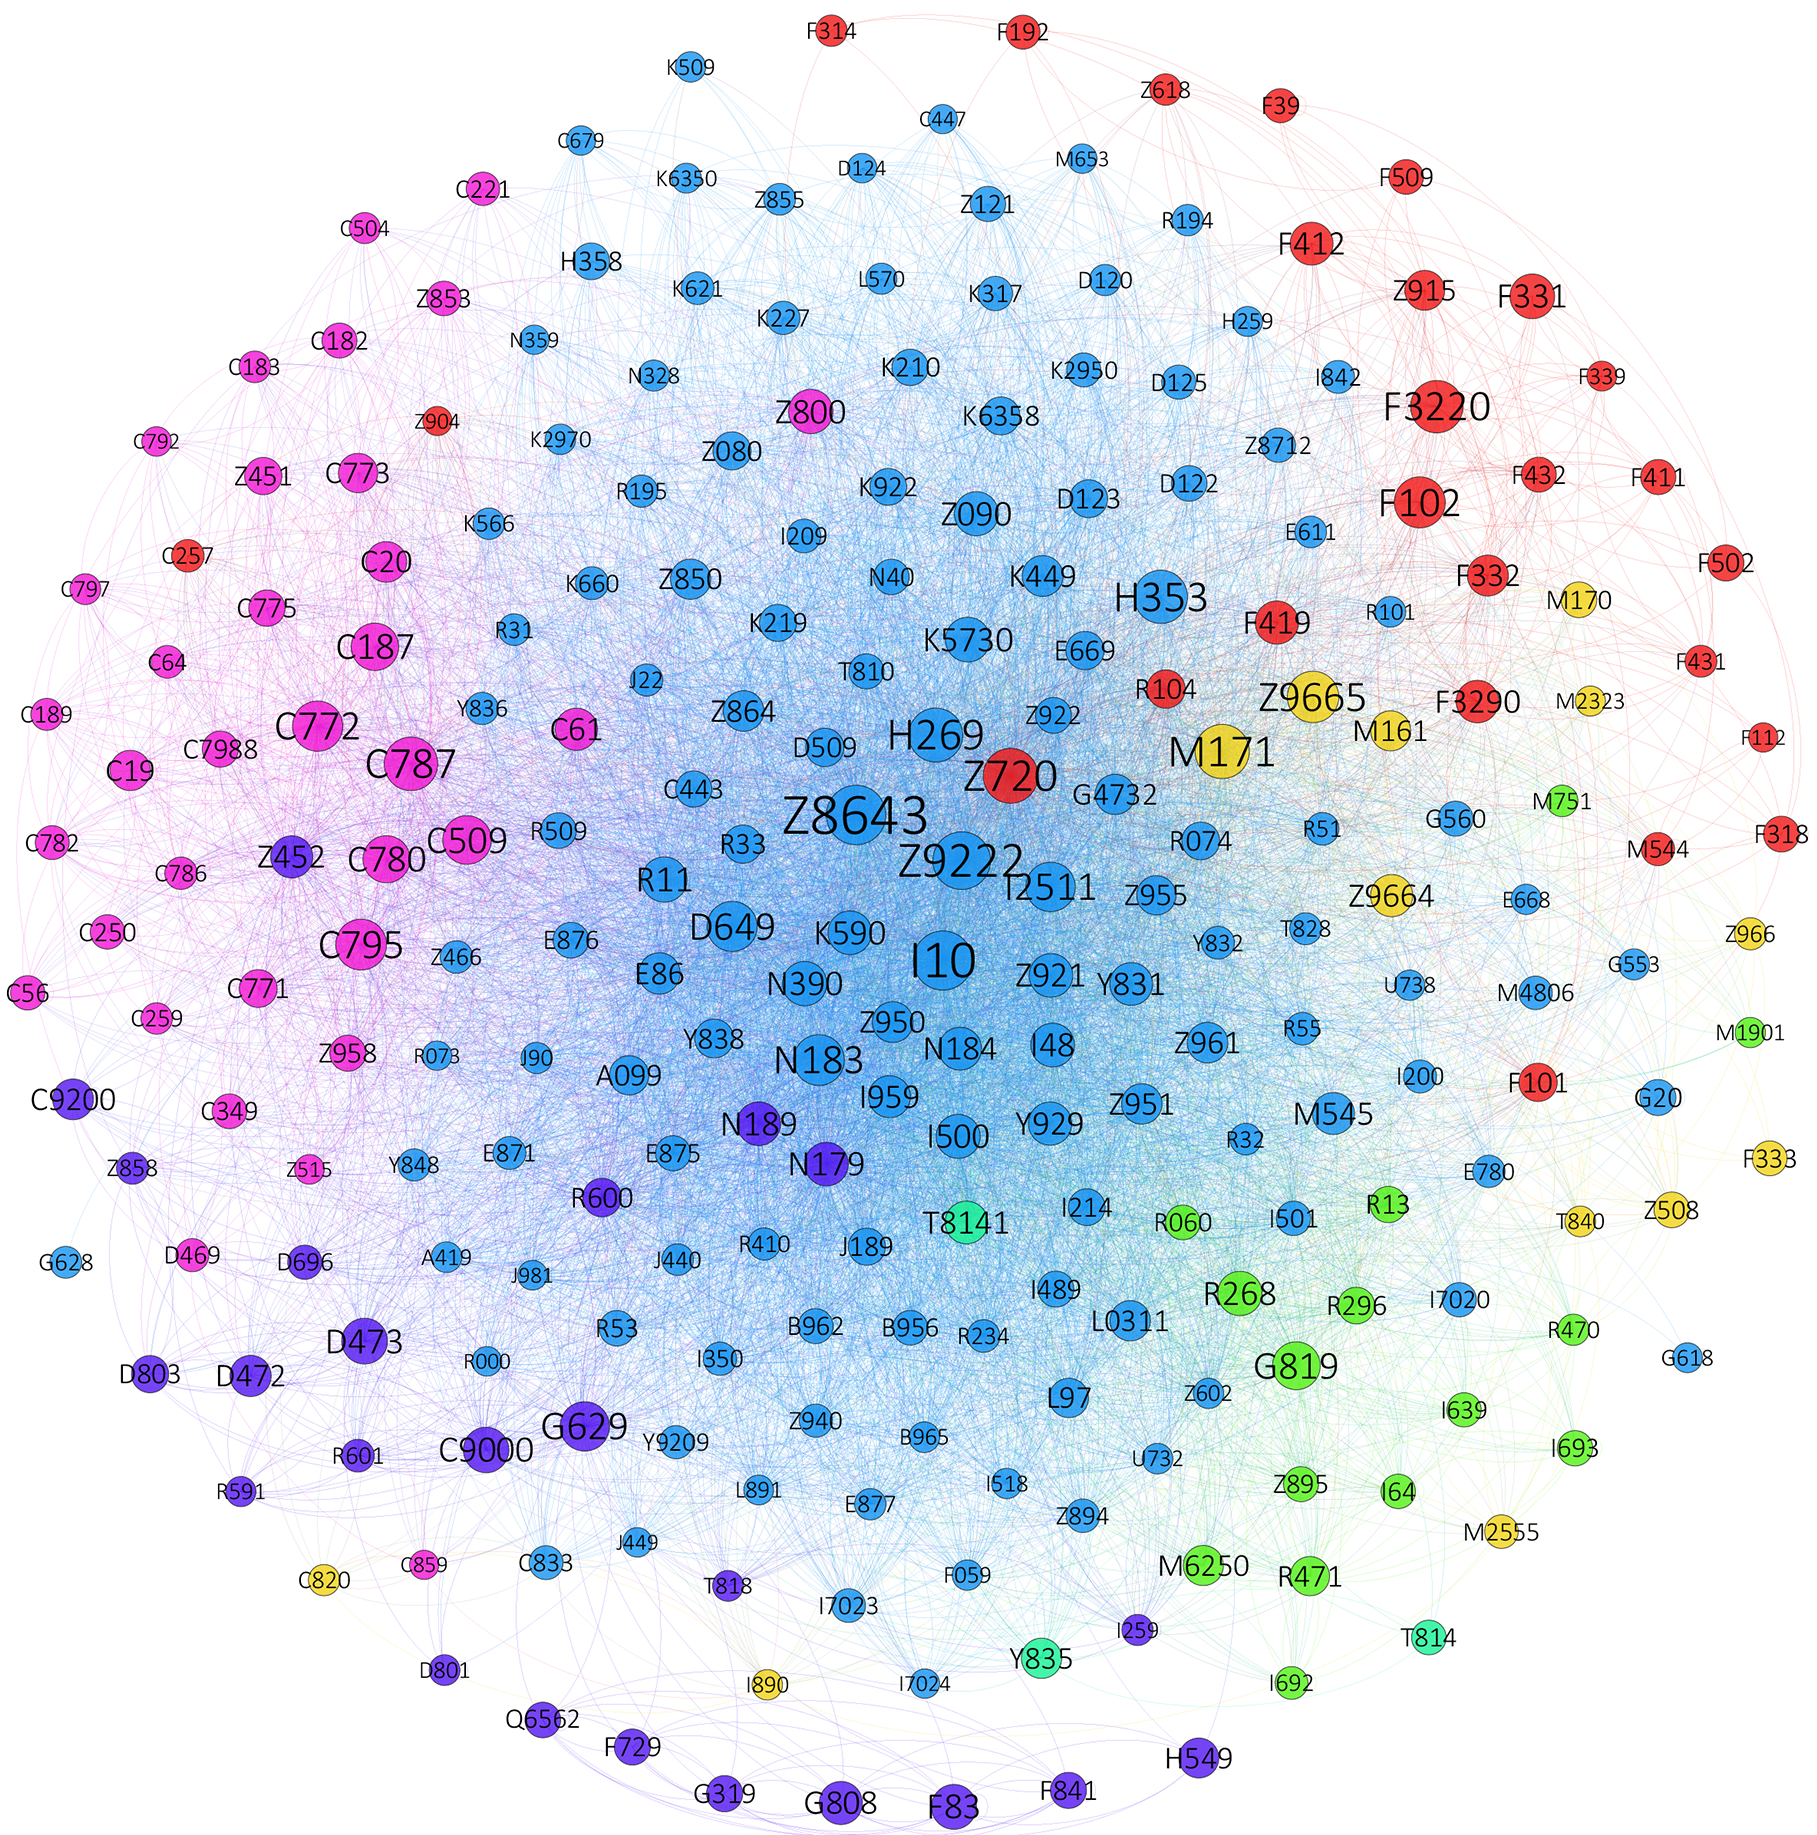 Figure 2: The Baseline Network for Type-2 Diabetes. Node size indicates connectivity, and colors represent distinct comorbidity clusters (e.g., Cluster 0 for Hypertension and Kidney Disease).
Experimental Insights
By testing the framework on sample cases, the authors demonstrated that the Relative Risk Score provides a nuanced gradient of health trajectories.
- Cluster 0 (37.3%): Dominant associations between hypertension, heart disease, and chronic kidney disease.
- Cluster 4 (7.4%): Strong links between smoking, depression, and mental health disorders.
- Closer Alignment = Higher Risk: Patients whose transition patterns (edges) mirrored the high-strength edges of the baseline were flagged as higher risk, even if their total number of diagnoses was lower.
Critical Analysis & Conclusion
Takeaway
The shift toward graph-based trajectory analysis allows for "Knowledge Management" in healthcare. Instead of treating symptoms as they appear, providers can see the "path" a patient is on and intervene before they reach the next node in a high-risk cluster.
Limitations
The study is constrained by the fragmentation of healthcare data. In the Australian context used by the authors, GP (general practitioner) records are often separate from hospital admission data. Consequently, the "first diagnosis" might actually be missing if it occurred in a primary care setting rather than a hospital.
Future Outlook
This framework is highly scalable. The authors suggest it can be applied to any chronic condition (Arthritis, Kidney Disease) simply by swapping the ICD-10 filter. As we move into the era of AI, integrating this graph topology with Deep Learning (like Graph Convolutional Networks) could refine these risk scores into highly accurate early-warning systems.