
Mapping the Digital Divide: How Socio-Economic Factors Fuel Online Hate Speech in Italy
Leveraging Hate Speech Detection to Investigate Immigration-related Phenomena in Italy
This paper presents a cross-disciplinary framework for investigating anti-immigrant sentiment in Italy by integrating automated Hate Speech (HS) detection on Twitter with official socio-economic indicators from ISTAT. The authors utilize an SVM-based classifier to analyze geo-tagged Italian tweets over a six-year span (2012-2017), mapping online hostility against offline demographic data.
Executive Summary
TL;DR: This research investigates the "Why" behind online xenophobia by correlating six years of Italian Twitter data with official national statistics (ISTAT). The study finds that online hate speech against immigrants is not random; it is significantly driven by local labor competition and specific types of perceived criminality, such as petty theft.
Context: Moving beyond simple text classification, this work acts as a bridge between Computational Social Science and Natural Language Processing (NLP), positioning itself as a diagnostic tool for social integration and political stability.
Problem & Motivation: Beyond Accuracy Metrics
Most Hate Speech (HS) detection research focuses on the "What" (identifying a hateful tweet) and the "How" (improving F1 scores). However, this leaves a vacuum in understanding the societal catalysts.
The authors argue that online discourse mirrors real-life anxieties. In Italy, a country where net migration accounted for 108% of total population change in recent years, the friction between humanitarian solidarity and economic protectionism is palpable. The challenge lies in quantifying the relationship between "off-screen" reality (jobs, degrees, crimes) and "on-screen" hostility.
Methodology: Bridging Big Data and Official Statistics
The researchers developed a pipeline to process the TWITA dataset (a massive collection of Italian tweets) through several filters:
- Keyword Filtering: Using a refined list of terms related to minority groups, expanded via the Open Multilingual Wordnet.
- Geographic Grounding: Extracting GPS metadata and applying reverse geocoding to map tweets to specific Italian municipalities and regions.
- Classification: Utilizing an SVM classifier (Linear kernel via Scikit-learn) trained on over 15,000 manually annotated tweets.
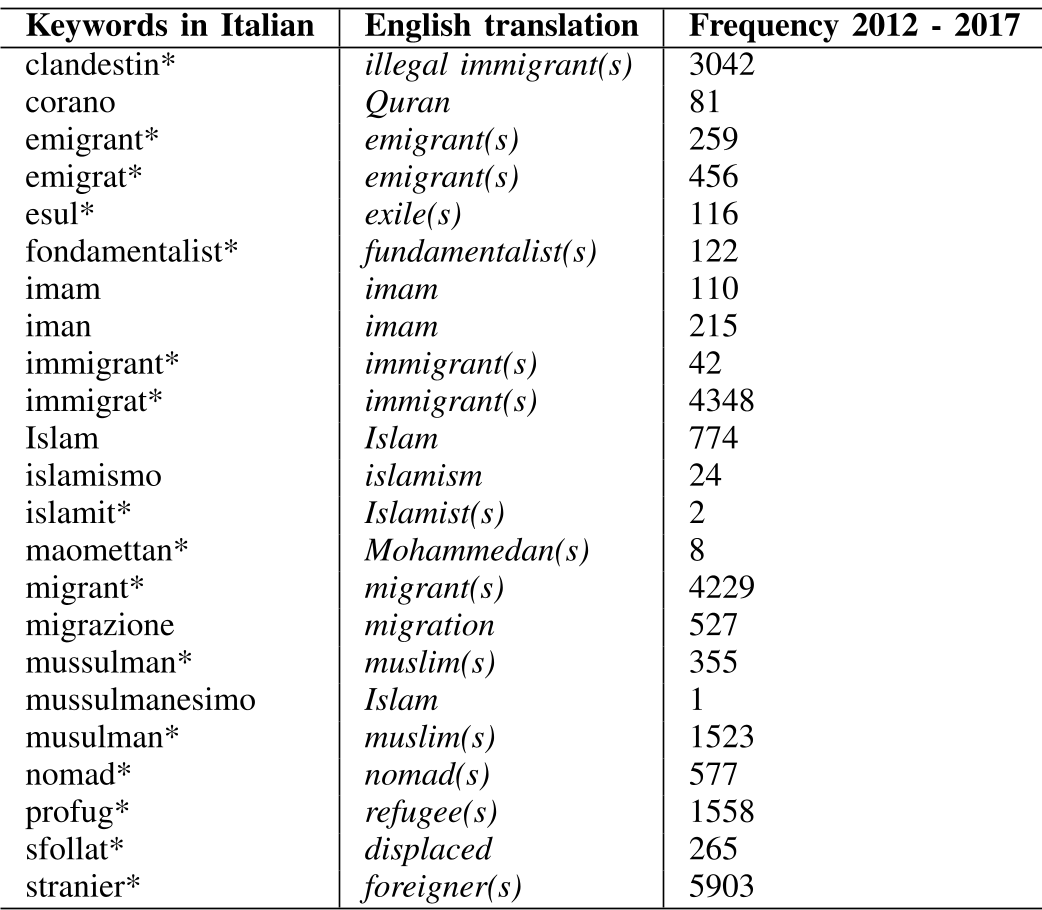
The resulting "Hate Speech Rate" per region was then correlated with ISTAT data on:
- Employment: Rates for both Italians and legal foreign residents.
- Education: Prevalence of middle school, high school, and university degrees.
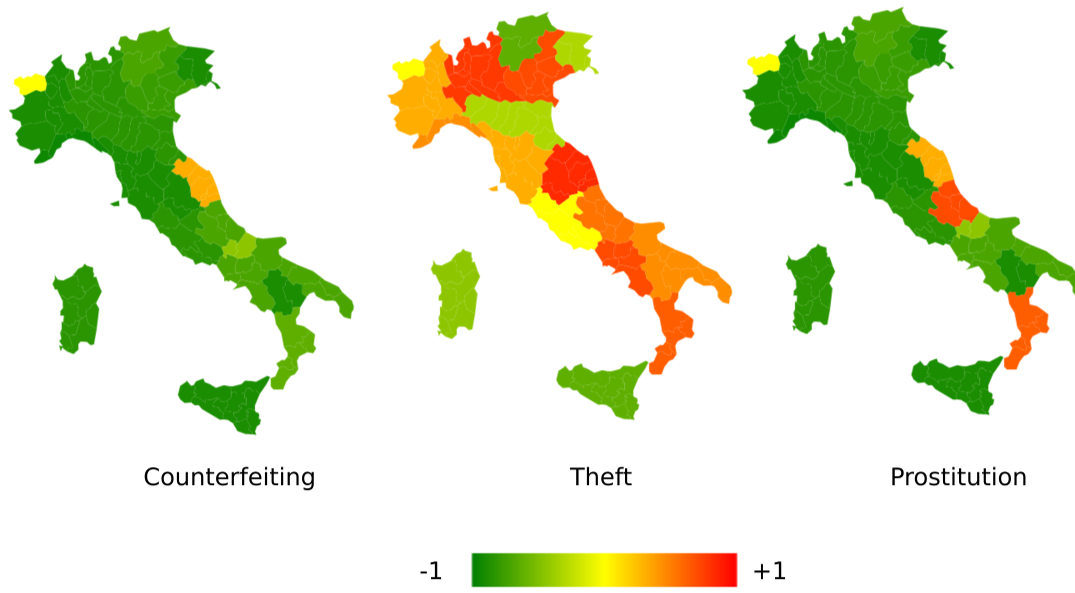
- Crime: Conviction rates for theft, counterfeiting, and prostitution.
Insights from the Data: The "Competitive Threat" Hypothesis
1. The Labor Market Friction
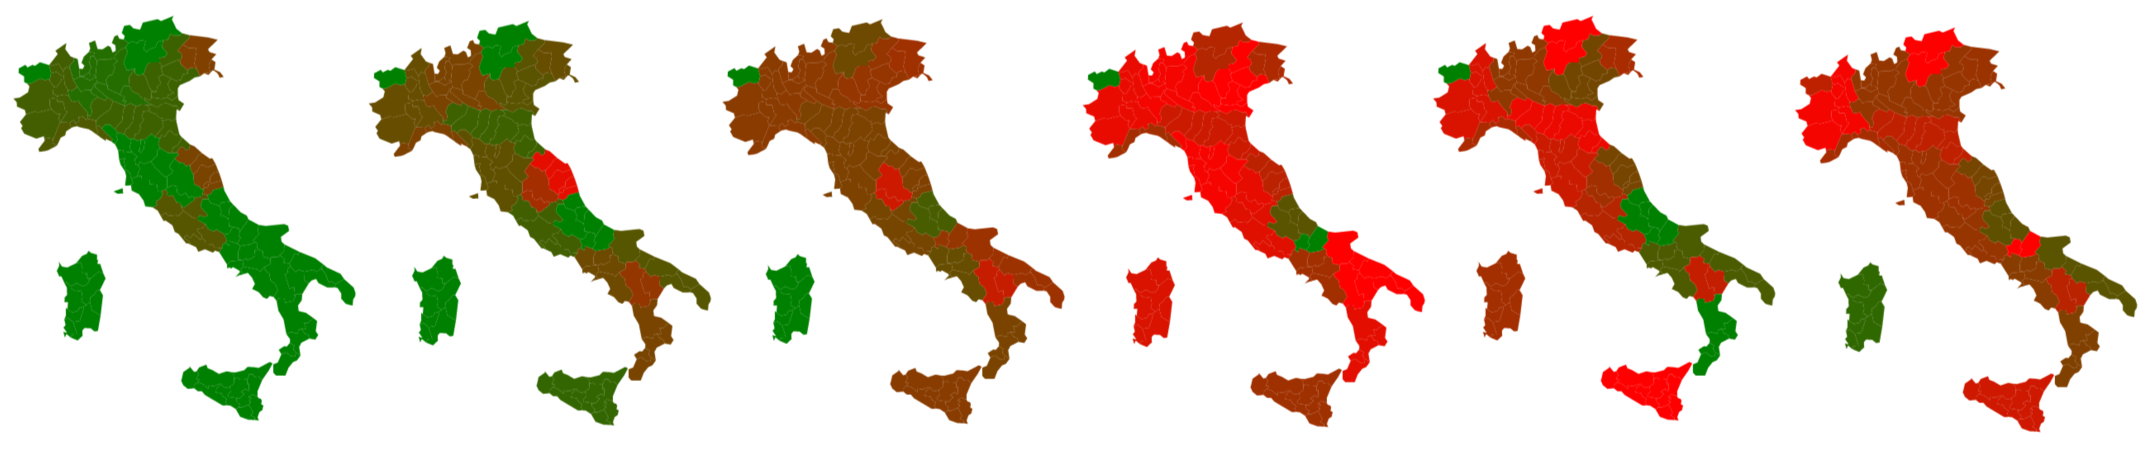
One of the most striking findings is the positive correlation between HS and the employment rate of foreigners. In the wealthier Northern regions, higher immigrant participation in the workforce correlates with increased online hostility. This suggests that hate speech is often a reaction to perceived labor competition.
2. The Education Paradox
Counter-intuitively, the data showed that higher education levels among natives often correlated with more detected hate speech.
- Interpretation: In highly educated areas, the job market is more competitive. Foreigners with higher education levels may be perceived as a direct threat to high-status roles, triggering a xenophobic backlash.
3. Perception of Safety vs. Reality
The study distinguished between types of crimes. While petty theft (which impacts personal safety) showed a high correlation with HS, crimes like counterfeiting or prostitution-related offenses did not. This indicates that online hate is specifically triggered by "direct-threat" perceptions rather than a general increase in criminality.
Deep Insight & Conclusion
Takeaway
The research successfully demonstrates that NLP-driven social monitoring can act as a "thermometer" for societal tension. The North-South socioeconomic divide in Italy is reflected in the digital sphere, with the "richer" North displaying different triggers for hostility than the South.
Limitations & Future Work
- Classifier Bias: The SVM was trained on 2017 data, which might not perfectly capture the linguistic nuances of 2012-2014.
- Platform Specificity: Twitter demographics in Italy may skew toward a more "politically active" or specific age group, potentially biasing the results.
- Future Path: The authors plan to integrate Deep Learning (neural networks) and explore the impact of political election cycles on HS spikes.
This work serves as a foundational case study for how governments and NGOs can use AI to not only remove toxic content but also address the underlying socio-economic grievances that create it.