
Predictive Data Mining: Decoding the Determinants of Healthcare Coverage Disparity
Analysis of healthcare coverage: A data mining approach
This study utilizes advanced machine learning techniques, specifically Artificial Neural Networks (ANN) and Decision Trees (CART), to analyze and predict healthcare coverage disparities in the US. Using the 2004 BRFSS dataset with over 190,000 records, the Multi-Layer Perceptron (MLP) model achieved a SOTA classification accuracy of 78.45% in identifying insured versus uninsured individuals.
TL;DR
The healthcare coverage gap in the United States is a persistent crisis that contributes to preventable hospitalizations and premature death. This study moves beyond simple descriptive statistics, employing Artificial Neural Networks (ANN) and Decision Trees to build a predictive model that achieves 78.45% accuracy in identifying uninsured individuals. The findings highlight Income, Employment, and Education as the primary drivers, while also surfacing the unexpected influence of lifestyle factors like smoking and alcohol consumption.
Problem & Motivation: Beyond Linear Correlations
Why is healthcare coverage still such a "black box" for policymakers? Historically, researchers have relied on Logistic Regression—a tool that assumes linear relationships between variables. However, the socio-economic factors influencing insurance are rarely linear; they are a web of interconnected dependencies (e.g., the "cliff effect" where a slight increase in income might lead to a total loss of subsidies).
The authors argue that traditional models suffer because they cannot handle multicollinearity (where independent variables like education and income are highly correlated) or non-normal data distributions. By applying machine learning, this study aims to:
- Build a Discriminatory Model: Move from "why there is a gap" to "who is in the gap."
- Handle Complexity: Utilize non-linear architectures to capture the nuanced "lifestyle" variables that traditional stats often miss.
Methodology: The Machine Learning Framework
The researchers processed 193,373 records from the 2004 Behavioral Risk Factor Surveillance System (BRFSS). To ensure the model wasn't biased by the majority class (since 84% of the population was insured), they implemented a balanced sampling strategy, creating a 50/50 split for training.
1. Multi-Layer Perceptron (MLP)
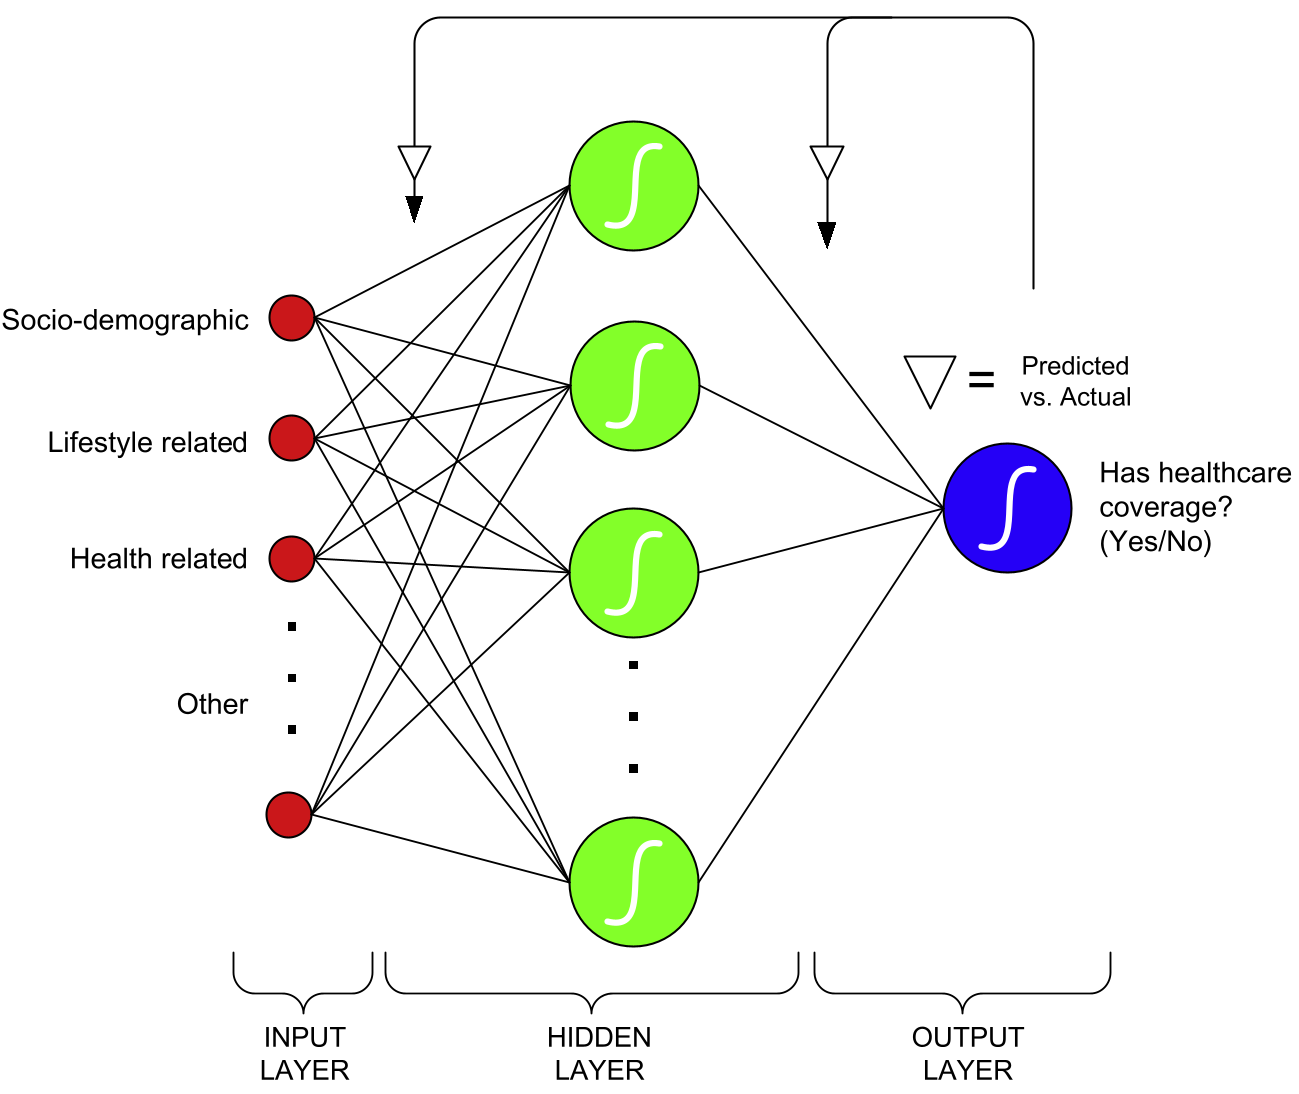
The star of the study was the MLP, a feedforward ANN architecture. By utilizing a "supervise-learning" back-propagation algorithm, the MLP functions as a universal function approximator, mapping 23 input variables through hidden layers to a binary output (Covered vs. Uninsured).
2. Decision Trees (CART)
The authors compared the ANN against Classification and Regression Trees (CART). Unlike the "black box" nature of neural networks, CART provides a transparent branching logic (using Gini indexes or Entropy) to segment the population based on thresholds.
Experiments & Results: What Drives the Gap?
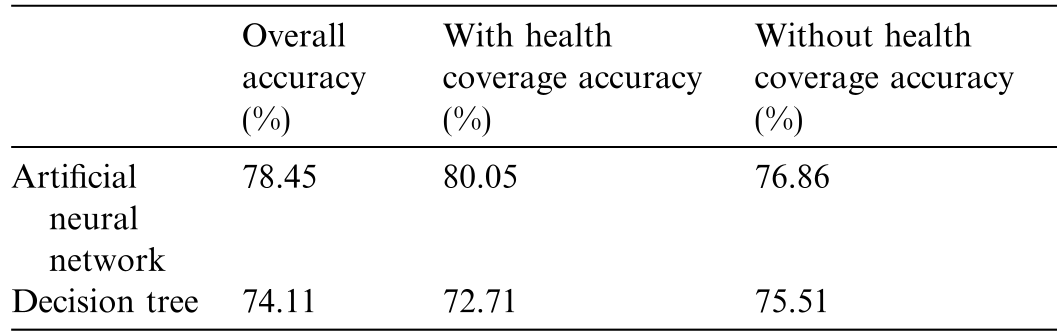
The experimental results were evaluated using 10-fold cross-validation, ensuring the models were robust and not overfitted to specific data segments.
| Model | Overall Accuracy | With Coverage Accuracy | Without Coverage Accuracy |
|---|---|---|---|
| Artificial Neural Network | 78.45% | 80.05% | 76.86% |
| Decision Tree (CART) | 74.11% | 72.71% | 75.51% |
Sensitivity Analysis: The Hierarchy of Uninsurance
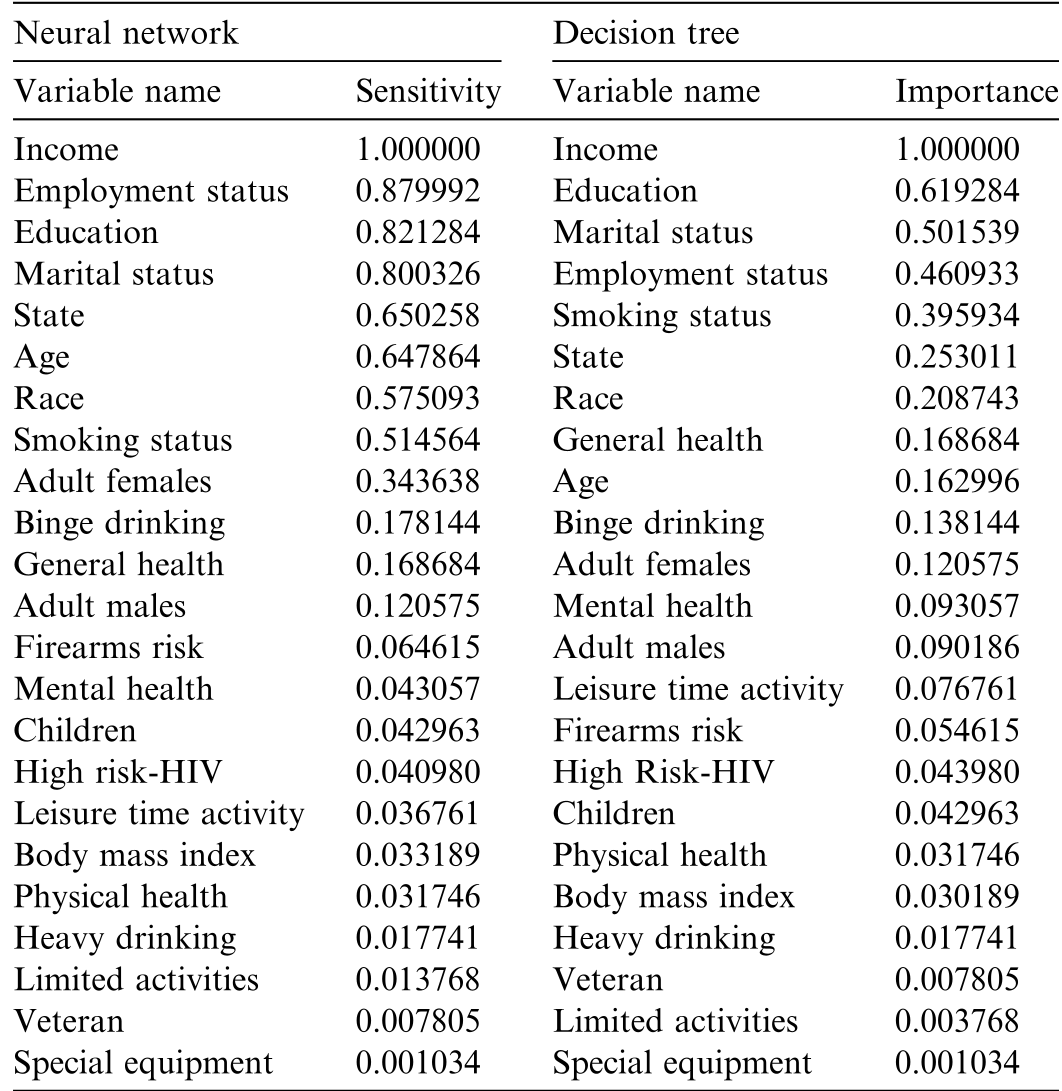
One of the most valuable outputs was the relative importance ranking.
- Income was the undisputed #1 predictor.
- Employment, Education, and Marital Status rounded out the top four.
- Lifestyle Surprise: Interestingly, Smoking Status and Binge Drinking were more predictive of healthcare coverage than common health metrics like Body Mass Index (BMI) or Physical Health days.
Critical Analysis & Conclusion
The Takeaway
The study proves that machine learning can accurately identify high-risk uninsured populations. For public health officials, this means they no longer need to "spray and pray" with awareness campaigns; they can target individuals by focusing on specific income brackets, employment types, and even lifestyle profiles.
Technical Insights
- Non-Linearity Wins: The ANN's superior performance over CART suggests that the "healthcare coverage" function is a complex, high-dimensional manifold rather than a simple set of binary rules.
- The Lifestyle Link: The importance of smoking and alcohol consumption suggests that "risk-taking behavior" might be a psychological latent variable that influences whether an individual seeks out or maintains insurance coverage.
Limitations
While powerful, the model is a snapshot of 2004 data (pre-ACA). The "State" variable was significant, suggesting that local policies heavily dictate coverage, which further underscores the need for localized AI models in public health.
Final Insight: Reducing the healthcare divide isn't just about medicine—it's about addressing the socio-economic "input nodes" of income and education that the neural network so clearly highlighted.