
Visualizing the Invisible: Heatmaps for Explainable CNNs in Healthcare Time Series
Heatmaps for Visual Explainability of CNN-Based Predictions for Multivariate Time Series with Application to Healthcare
The paper introduces a visual explainability framework for Convolutional Neural Networks (CNNs) tasked with multivariate Time Series (TS) classification. Using a channel-wise CNN architecture, it generates heatmaps to pinpoint critical variables and temporal segments, achieving state-of-the-art performance (AUC-ROC ~0.82) on the MIMIC-III in-hospital mortality prediction task.
TL;DR
Predicting patient mortality in ICUs requires more than just accuracy; it requires "Why." This paper presents a channel-wise CNN architecture that transforms black-box predictions into intuitive heatmaps. By applying this to the MIMIC-III dataset, the authors show how specific physiological variables like the Glasgow Coma Scale (GCS) and blood pressure patterns drive mortality risks over a 48-hour window.
Background: The Healthcare Paradox
In the ICU, every second counts, and every data point—from heart rate to pH levels—matters. While Deep Learning models like LSTMs and CNNs have reached impressive performance levels, clinicians are often hesitant to trust a model that cannot explain its reasoning. The paradox is that the most powerful models are often the least transparent. This paper tackles this by focusing on Visual Explainability.
Problem & Motivation
Standard CNNs often mix information across multiple variables (channels) early in the network, making it difficult to disentangle which specific variable caused a prediction. Furthermore, time series data adds a layer of complexity: it's not just what variable is abnormal, but when it became abnormal.
The authors' insight is simple yet powerful: Restructuring the CNN to process variables separately (channel-wise) allows the model to preserve the identity of each variable up until the final decision layer, making post-hoc heatmap generation mathematically straightforward and clinically relevant.
Methodology: The Channel-Wise Architecture
The core of the method lies in the feature extraction pipeline. Instead of a standard 2D convolution over a matrix, the model uses:
- Independent 1D Convolutions: Each of the variables (e.g., Heart Rate, Glucose) is processed by dedicated 1D filters.
- Global Average Pooling (GAP): This reduces the temporal dimension to a single feature per filter while retaining the "average energy" of the detected patterns.
- Heatmap Reconstruction: By multiplying the activation maps () by the weights of the final dense layer (), the model projects the "importance" back onto the original time-variable grid.
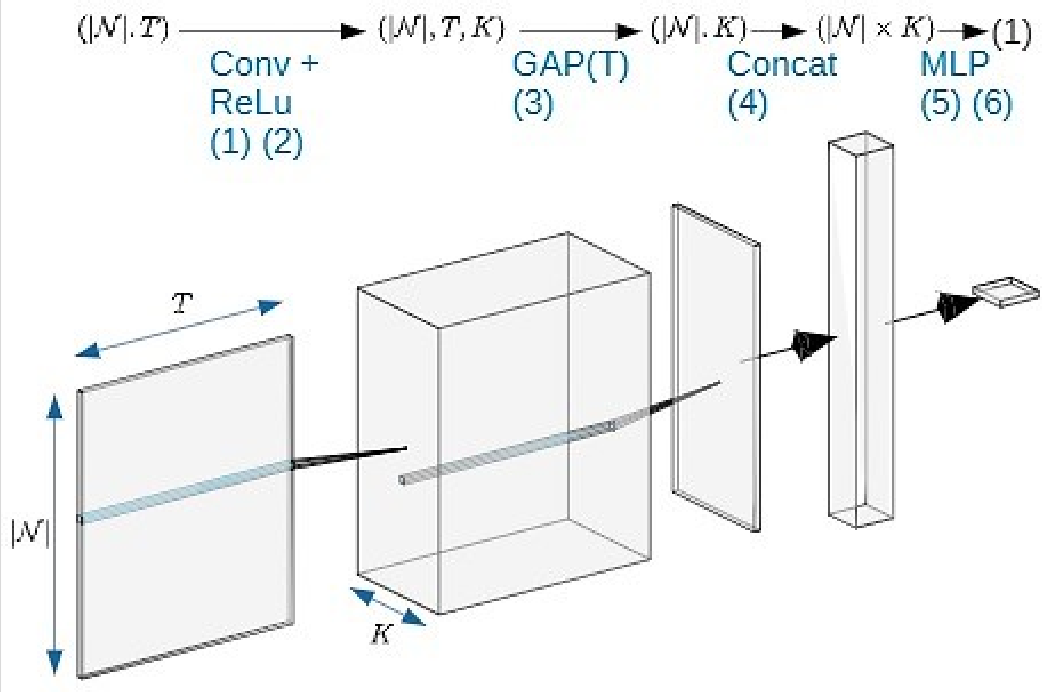 Fig 1: The Multi-channel CNN architecture ensures that features from different variables are only merged at the final stage.
Experiments: Validating with MIMIC-III
The authors tested their approach on 13,000 ICU records from the MIMIC-III database. The task was to predict in-hospital mortality based on the first 48 hours of data across 17 physiological variables.
Performance vs. Explainability
The model achieved an AUC-ROC of 0.82, performing on par with complex LSTM baselines. However, the real value lies in the heatmaps.
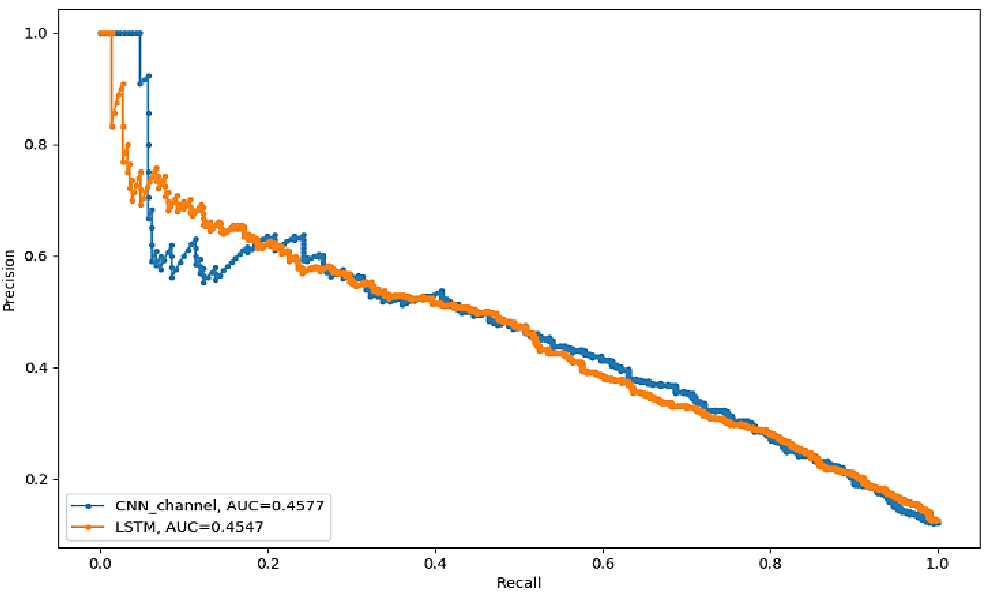 Fig 2: Heatmap for a specific patient. Note the "colder" (blue) region in Systolic BP after 38 hours, where blood pressure began to stabilize, reducing the predicted risk.
Statistical Rigor
To prove these heatmaps weren't just "pretty pictures," the authors performed t-tests comparing the heatmap values of survivors vs. non-survivors. They found:
- Clinical Alignment: Variables like GCS Total and GCS Verbal showed the highest discrepancy (t-values > 20), confirming clinical knowledge that neurological status is a primary predictor of mortality.
- Temporal Sensitivity: The model's ability to distinguish between groups significantly improved as time progressed toward the 48-hour mark, reflecting the "stabilization" of survivors versus the "deterioration" of high-risk patients.
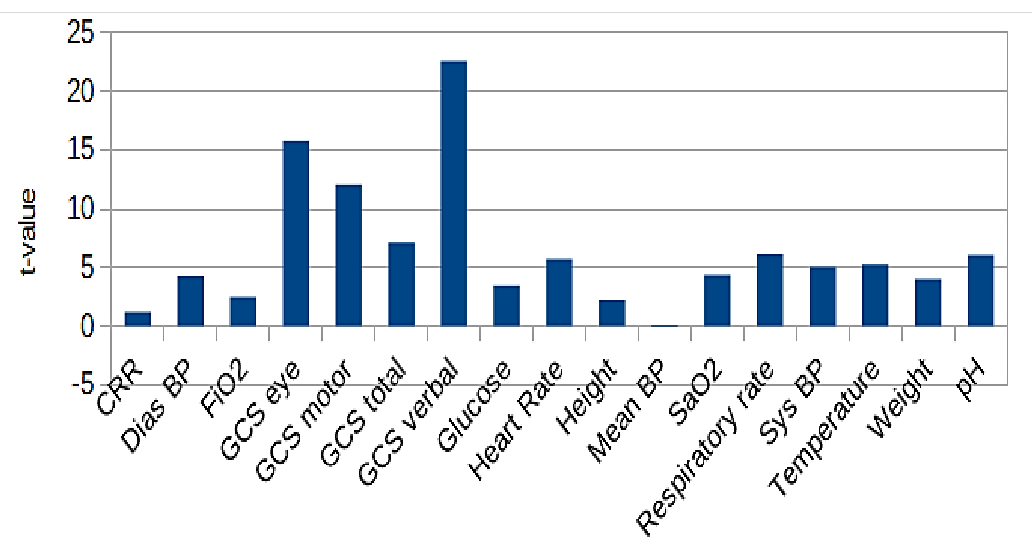 Fig 3: Statistical distribution of variable influence, highlighting the dominance of GCS and Blood Pressure.
Deep Insights & Conclusion
Takeaway
The study successfully demonstrates that Heatmaps are not just for Computer Vision. By using a channel-wise architecture, we can extract "temporal importance" and "variable importance" simultaneously.
Limitations & Future Work
- Model Complexity: The current CNN is relatively shallow. Integrating this into deeper architectures like ResNets or Transformers remains a challenge.
- Inter-variable Correlation: By processing channels independently, the model might miss complex interactions between variables (e.g., the relationship between pH and Respiratory Rate).
- Next Steps: The authors plan to bring these heatmaps to actual bedside clinicians to evaluate if this visual aid truly improves diagnostic speed and confidence.
In conclusion, this work provides a robust framework for making "Black-Box" healthcare AI more transparent, one pixel—or rather, one time-step—at a time.