
Hierarchical Social Network Analysis: Does More School Funding Actually Improve Performance?
Hierarchical social network analysis using multi-agent systems: A school system case
This paper presents a Multi-Agent System (MAS) framework to analyze the hierarchical structure of school districts in Bexar County, Texas. It introduces an interaction-based similarity measure for hierarchical clustering and leverages the MAXQ reinforcement learning algorithm to evaluate the relationship between funding policies and student performance.
TL;DR
Researchers have developed a multi-agent system (MAS) to map the social hierarchies of school districts. By using interaction frequency as a clustering metric and the MAXQ algorithm for policy evaluation, the study finds that simply throwing money at school districts does not guarantee better student results—except in specific, high-resource military-base contexts.
Background: Beyond Statistical Silos
In education research, the "funding vs. performance" debate is often stuck in a cycle of univariate statistics. Does smaller class size help? Does teacher certification matter? This paper argues that schools are social networks, and we must understand their hierarchical structures to evaluate performance effectively. By treating students, teachers, and administrators as interacting agents, the authors transition from static data tables to a dynamic multi-agent simulation.
Methodology: Mapping the Social Fabric
The core of this research rests on two technical pillars:
1. Interaction-based Hierarchical Clustering
Standard clustering uses Euclidean distance. However, in a school, a student is "closer" to their teacher than to the superintendent. The authors define a similarity measure based on Social Interaction Level.
- High Interaction: Regular education teachers and students (Score: 9).
- Low Interaction: Students and Central Administrative staff (Score: 0).
The algorithm uses an agglomerative approach (bottom-up) and Average Linkage to group these agents until a complete school district hierarchy is revealed in a dendrogram.
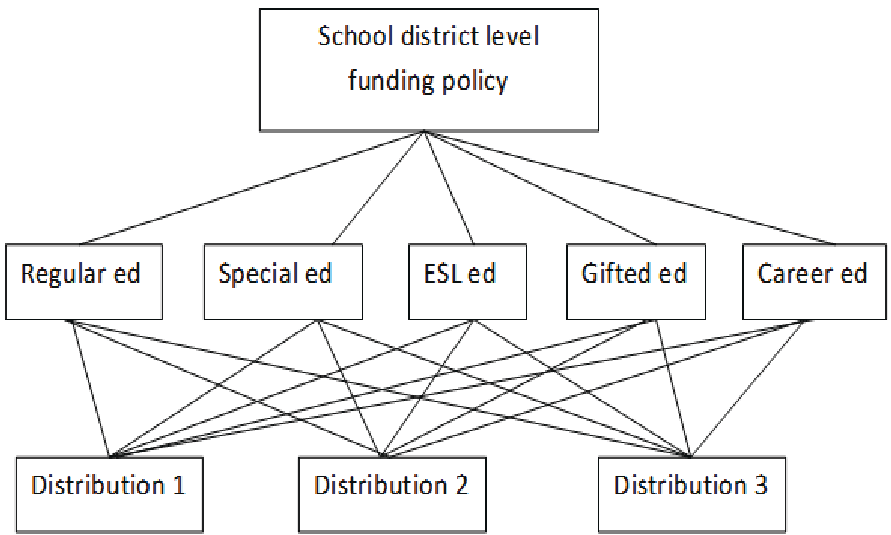 Fig 1. Decomposition of the funding distribution task into sub-areas using the MAXQ framework.
2. Funding Evaluation via MAXQ
To evaluate policy, the authors treat funding as a reinforcement learning problem. Using the MAXQ Value Function Decomposition, they break down the goal of "Improving Performance" into subtasks:
- Subtasks: Regular, Special, Bilingual, Career, and Gifted education sectors.
- Reward Function: Directly tied to the TAKS (Texas Assessment of Knowledge and Skills) test passing rates.
The value function is decomposed as: Where represents the reward within a subtask and (the completion function) represents the reward for finishing the parent task.
Experiments: The Bexar County Case Study
The researchers analyzed 15 school districts in Bexar County, Texas.
Results: Visualizing Hierarchy
The clustering algorithm produced detailed dendrograms, successfully separating students into their specialized learning groups before merging them with administrative layers.
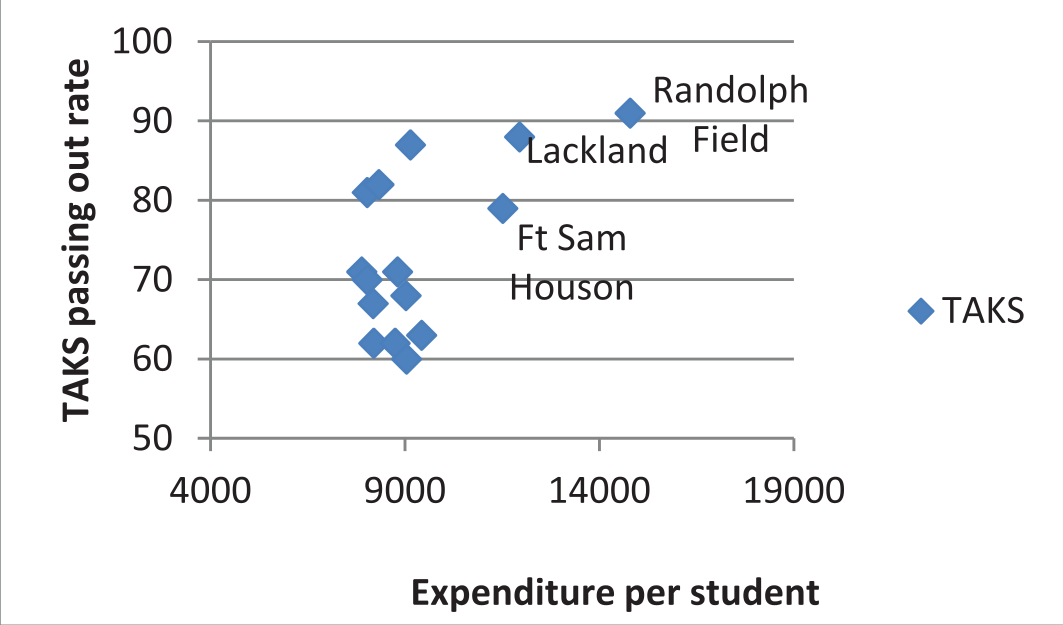 Fig 2. Hierarchical structure of a top-performing district (Lackland), showing the merging of student-teacher clusters.
The "Funding Paradox"
The most striking result is the lack of a linear relationship between expenditure and results.
- The Flatline: For districts spending under $10,000 per student, more money did not necessarily move the needle on test scores.
- The Military Exception: Districts like Randolph Field, Lackland, and Ft. Sam Houston (military bases) showed significantly higher performance, but their expenditure was also vastly higher—often exceeding $14,000 per pupil.
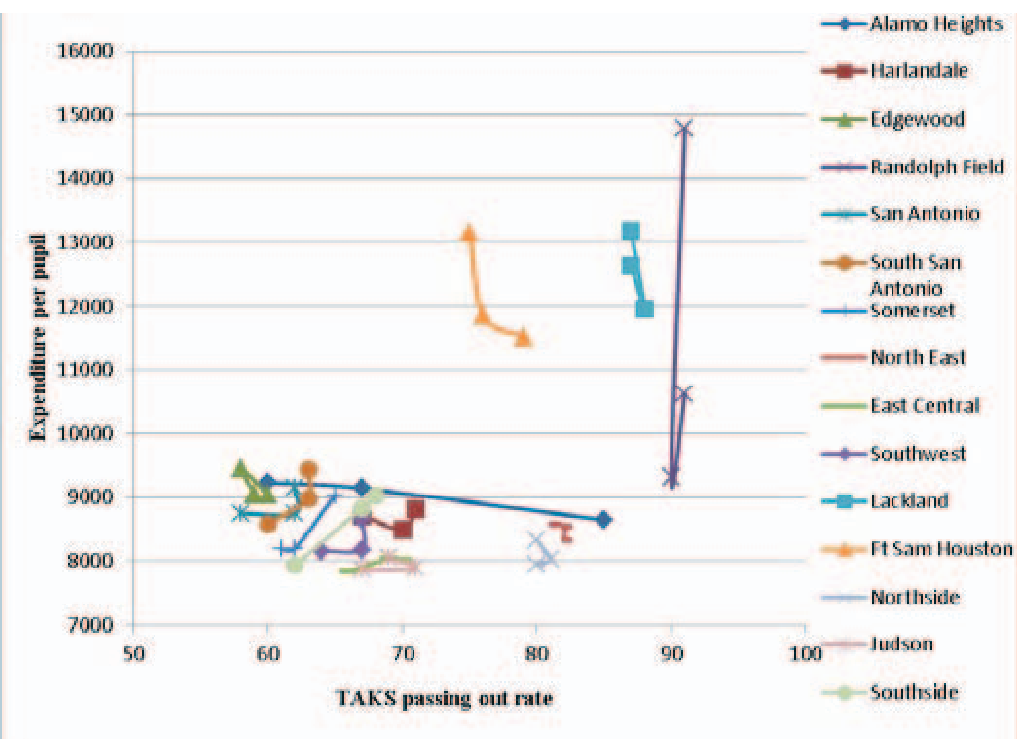 Fig 3. Best TAKS passing rates vs. Expenditure per student across 15 districts.
Critical Insight & Conclusion
The study suggests that organizational efficiency and interaction density are as critical as the budget itself. The three "Military Base" districts serve as outliers precisely because their high funding is coupled with unique social structures. For the average district, "spending better" outweighs "spending more."
Limitations & Future Work
The model currently excludes external agents like parents and private vendors. Furthermore, the "learning" aspect of the MAXQ algorithm was constrained by data availability; future iterations could use real-time student tracking to allow the agent to "discover" optimal funding allocations autonomously.