
Function Insight: Navigating Binary Complexity via Heuristic Highlighting
Highlighting Suspicious Sections in Binary Run Traces
This paper introduces Function Insight, a binary reverse engineering tool designed to visualize execution traces at the functional level. Its core innovation is a heuristic-based "interest metric" system that automatically highlights suspicious code sections using rule-based, machine learning, and data mining techniques.
TL;DR
Function Insight is a specialized visualization tool that shifts reverse engineering from tedious line-by-line assembly inspection to high-level functional analysis. By implementing a pluggable heuristic system, it automatically highlights "suspicious" activities—such as socket communications or anti-debugging tricks—and provides a differential mode to compare clean and compromised execution traces.
Problem & Motivation: The Assembly Bottleneck
In the world of malware analysis and Red Teaming, analysts often face a "mountain of data" problem. A single execution run can generate hundreds of thousands of function calls. Traditional tools provide two extremes:
- Low-level Debuggers: Granular but overwhelming.
- Standard Profilers: Good for performance but blind to security anomalies.
The authors identified a critical gap: the lack of a tool that directs human attention. Why waste hours on standard library calls when the "interesting" behavior—the malware payload or the obfuscation logic—is buried in just 1% of the trace?
Methodology: Intelligence via Heuristics
The heart of Function Insight is its Interest Metric. Instead of a hard-coded definition of "suspicious," the tool treats interest as a weighted probability.
1. Multi-Source Heuristics
The framework supports three types of discovery:
- Rule-based: Identifying known "bad" patterns (e.g., specific API calls for file access or network persistence).
- Machine Learning/Data Mining: Using Sequential Pattern Mining to learn "normal" execution flows and flagging deviations.
- User-defined: Analysts can inject Java-based logic to target specific behaviors unique to their target.
2. Functional Abstraction
By utilizing the Data Code Miner profiler, Function Insight reconstructs the call tree, allowing users to see parameter types, register values, and return addresses without losing the "big picture" of the software's execution flow.
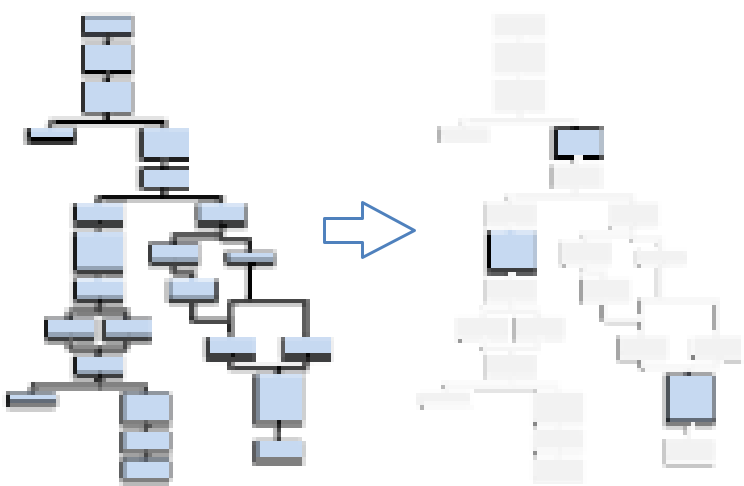 Figure 1: The Function Insight interface, demonstrating how specific sections of the trace are shaded based on their calculated interest scores.
Differential Analysis: The Power of Comparison
One of the most effective ways to find a "needle in a haystack" is to compare it to a haystack that you know is clean. Function Insight’s Diff Mode allows side-by-side execution comparison.
However, the authors acknowledge a common pitfall: Execution Noise. Two runs of the same program are rarely identical due to memory offsets and timestamps. Their future research focuses on moving beyond "simple equality" toward Similarity Metrics that ignore inconsequential fluctuations while highlighting structural deviations.
Critical Analysis & Conclusion
Function Insight moves the needle for reverse engineering by serving as a "test bed" for anomaly detection algorithms.
Key Takeaways:
- Context is King: Identifying an API call is easy; identifying an unexpected API call sequence is where the real value lies.
- Extensibility: By opening an API for Java-based plugins, the tool stays relevant as new malware techniques emerge.
Limitations:
The current version relies heavily on exact matches in its diffing engine, which can lead to false positives. The transition to more robust similarity metrics (as proposed in their Future Research section) will be the deciding factor in its long-term utility for complex, modern protected binaries.
In summary, Function Insight isn't just a profiler—it's a cognitive force multiplier for the reverse engineer.