
HighNyammer Social Scanner: Turning Social Network Analysis into Actionable Feedback for Student Communities
HighNyammer Social Scanner: collective cognitive responsibility visualization based on network analysis
This paper introduces "HighNyammer Social Scanner," a feedback tool integrated into a Bulletin Board System (BBS) to enhance Collective Cognitive Responsibility (CCR) in extracurricular student-staff communities. The tool leverages Social Network Analysis (SNA)—specifically betweenness centrality—to provide real-time visualizations of community interactions, helping members transition from isolated contributors to collaborative "key persons."
TL;DR
Building a sense of Collective Cognitive Responsibility (CCR) in a group is notoriously difficult without a formal teacher. This paper introduces the HighNyammer Social Scanner, a tool that uses Social Network Analysis (SNA) to show students exactly how they are connected to their peers. By visualizing "betweenness centrality" through interactive graphs, the system encouraged novice student-staff members to stop working in silos and start acting as vital connectors within their knowledge-sharing community.
Background: The Problem with Anonymous Centrality
In any collaborative community, "betweenness centrality" is a key indicator of health. It measures how often a member acts as a bridge between other members. High CCR means that responsibility for knowledge is distributed, and members actively seek to bridge gaps.
However, the authors' prior work found a major bottleneck: Numerical feedback is too vague. Simply telling a student their centrality score is low doesn't tell them why or who they should talk to. Without a map of the social landscape, students—especially novices—feel lost in the data.
Methodology: The Three Pillars of Social Feedback
To solve this, the researchers implemented the "Social Scanner" features into the HighNyammer BBS. They hypothesized that seeing the structure of the network would be more impactful than seeing a simple score.
1. The Visualization Triage
The system provides three distinct views to help students self-regulate their social behavior:
- Yearly Trends: Shows the "pulse" of the community over time.
- Weekly Rankings: Provides a gamified sense of standing compared to peers.
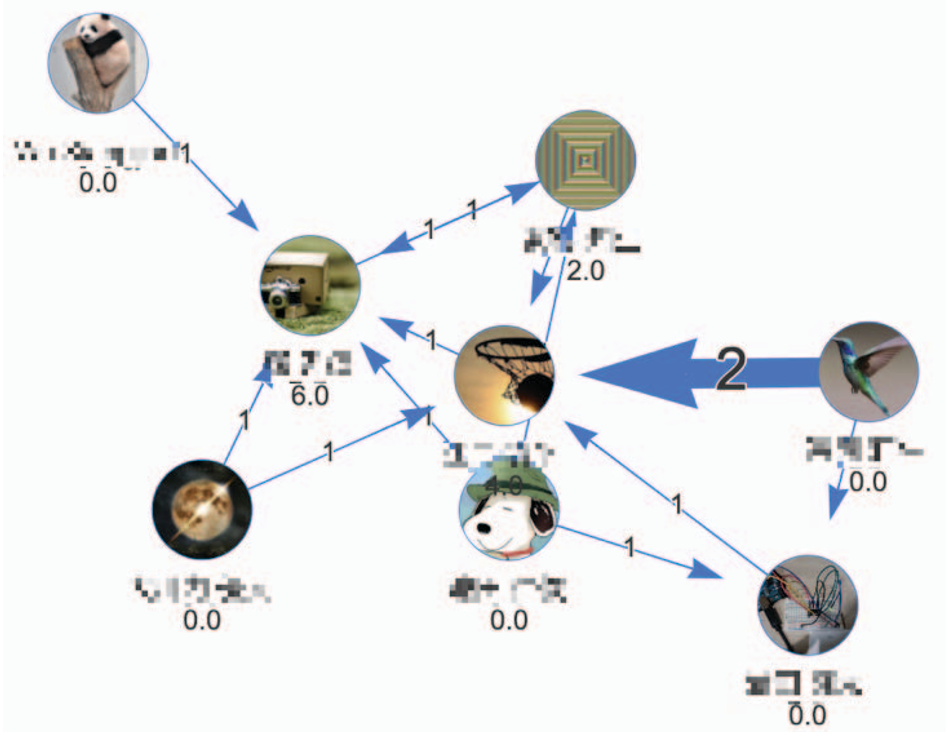
- Social Network Graph: The "Killer Feature." A directed graph showing who replied to whom.
Why it Works: From "What" to "How"
The core of the methodology lies in Function (3) - Social Network View. Unlike traditional dashboards that summarize activity (e.g., "you posted 5 times"), the graph view externalizes the quality of social effort. If a member sees themselves on the periphery of the graph, they can immediately identify "unconnected nodes"—colleagues who haven't received replies—and target them for future interaction.
Experimental Results: Novices Stepping Up
The study compared logs from 2019 (no scanner) and 2020 (with scanner) in a university "Classroom-M" environment.
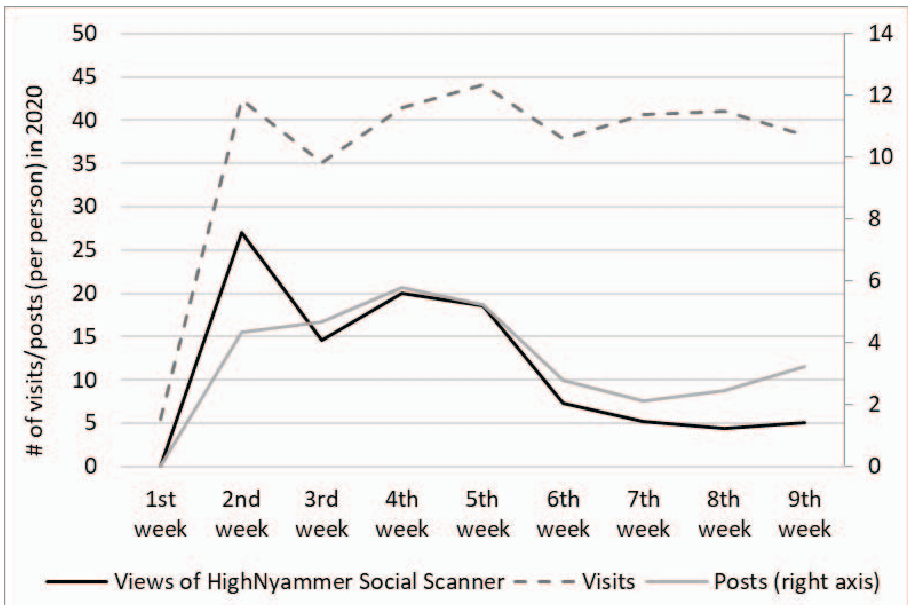
- Quantitative Shift: Chi-square tests revealed significant changes in posting and visiting behavior (p < .01). Even during vacation periods, staff members remained engaged.
- The Power of the Graph: Statistical analysis (ANOVA) showed that the Social Network function was used significantly more (42.4%) than the numerical yearly trends.
- Qualitative Impact: Questionnaire data showed that four out of five members used the graph to decide whose articles to read or who needed advice. Staff B noted: "I keep in mind to give comments... to authors who were not related to me using the Social Network function."
Deep Insight: Beyond Metrics
The true value of this work is the shift from Monitoring to Scaffolding. Most "Learning Analytics" tools are designed for teachers to catch "slacker" students. HighNyammer Social Scanner flips this, putting the data in the hands of the students themselves.
Limitations & Future Work
The study was conducted with a small sample size (9 members), which limits generalizability. However, the qualitative evidence that it helped "novices" adopt high-CCR behaviors as quickly as veterans is a promising sign for onboarding strategies in technical organizations.
Conclusion
The HighNyammer Social Scanner demonstrates that in a knowledge-building community, a picture (or a graph) is worth a thousand data points. By making the "Social Fabric" visible, we can empower individuals to take responsibility for the collective group's success.