
Structuring Exploration: A History Mechanism for Visual Data Mining
A History Mechanism for Visual Data Mining
This paper introduces a robust history management mechanism for Visual Data Mining (VDM) frameworks, enabling sophisticated undo/redo, re-execution, and progressive refinement. It formalizes VDM as a state-transition system and implements a hierarchical history tree within the InfoVis framework to improve user orientation and knowledge reusability.
TL;DR
Visual Data Mining (VDM) is inherently iterative and non-linear, yet many systems treat it as a fleeting sequence of interactions. This paper presents a formal history mechanism that captures the entire analytical workflow in a structured History Tree. By storing actions and operator states rather than raw data, it enables efficient undo/redo, comparative analysis of different branches, and the persistence of "analytical insights" through a metadata-rich interface.
Background: The "Trial and Error" Bottleneck
In the realm of VDM, exploration is rarely a straight line. Users frequently adjust clustering parameters, switch visualization metaphors, or filter subsets of data, often arriving at a "dead end." Shneiderman’s 1996 taxonomy explicitly called for a history task to support progressive refinement, yet many systems still fail to provide more than a basic linear undo. The result? Users lose their way in a forest of overlapping windows and cannot reliably reproduce findings from an hour prior.
Methodology: Formalizing the History of Insight
The authors move beyond simple software engineering "undo" by providing a mathematical foundation for VDM history. They define the system as a 7-tuple , where represents the history tree.
Core Insight: Action-Based Storage
Instead of high-cost system state snapshots, the authors adopt Action Storage. By recording the transformation function and its parameters, they can reconstruct any state by traversing the tree from the root. This is particularly effective for VDM because many mining operators (like clustering) are computationally deterministic but memory-heavy.
Architecture and Dependency Mapping
A critical aspect of this work is the distinction between system-defined dependencies (where one operator's output is another's input) and user-defined temporal dependencies (the sequence in which a user clicked things).
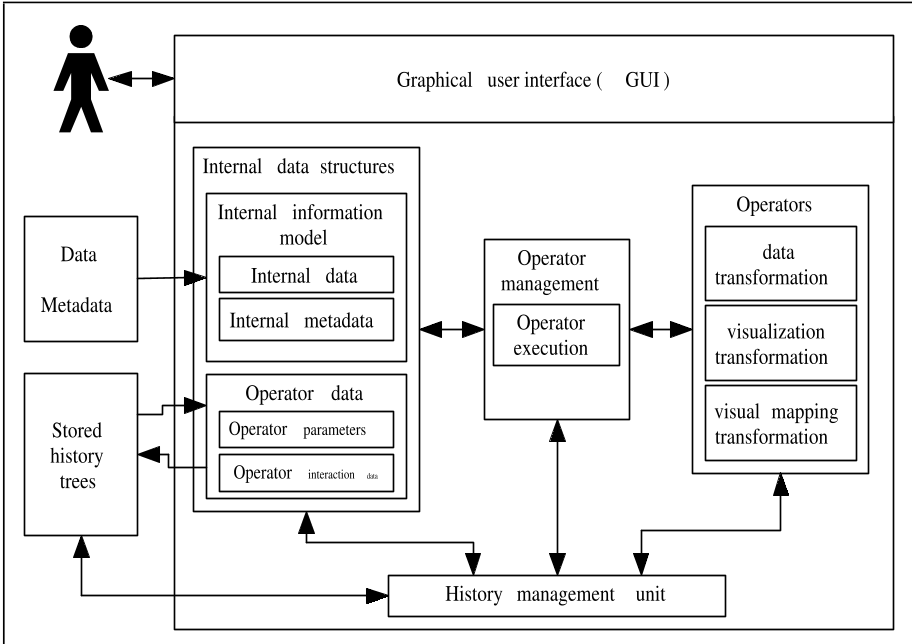
Figure 1: The integration of History Management between the Operator Library and the GUI permits seamless state recall.
The History Tree GUI
The most visible innovation is the History Tree Visualizer. Unlike previous works that used small screenshots (which become unreadable when scaled down), this system uses abstract metaphoric icons.
- Triangles indicate data transformations.
- Dashed lines represent temporal sequences.
- Solid lines represent hard data dependencies.
This allows users to "jump" to any point in their analysis, spawning new branches to explore alternative hypotheses without destroying their previous work.
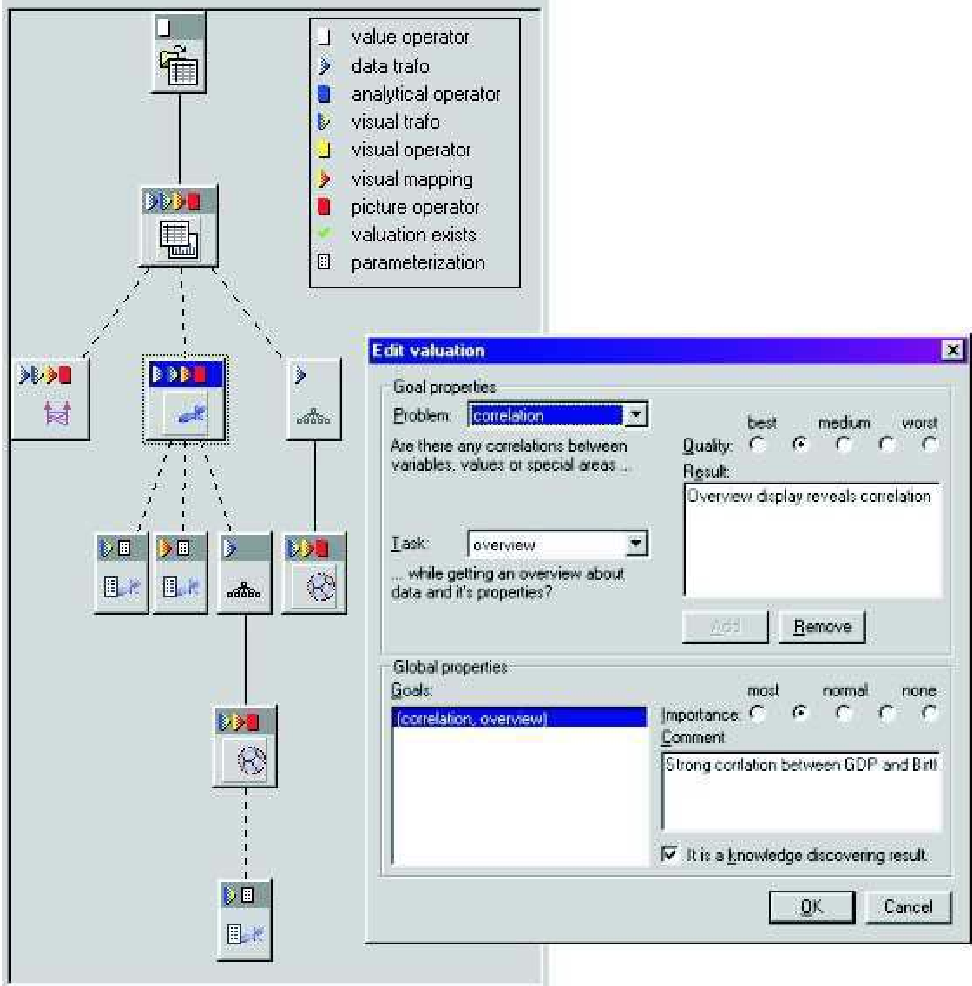
Figure 2: The history tree interface (left) allows for node selection and branch re-execution, paired with an editor (right) for annotating insights.
Experiments: Real-World Demographic Analysis
The authors demonstrated the framework using a demographic dataset of world countries. In a scenario involving hierarchical clustering followed by selective visualization (ShapeVis and Parallel Coordinates), the history mechanism allowed the user to pinpoint the "Botswana anomaly" and then easily roll back to explore other clusters without re-configuring the entire pipeline.
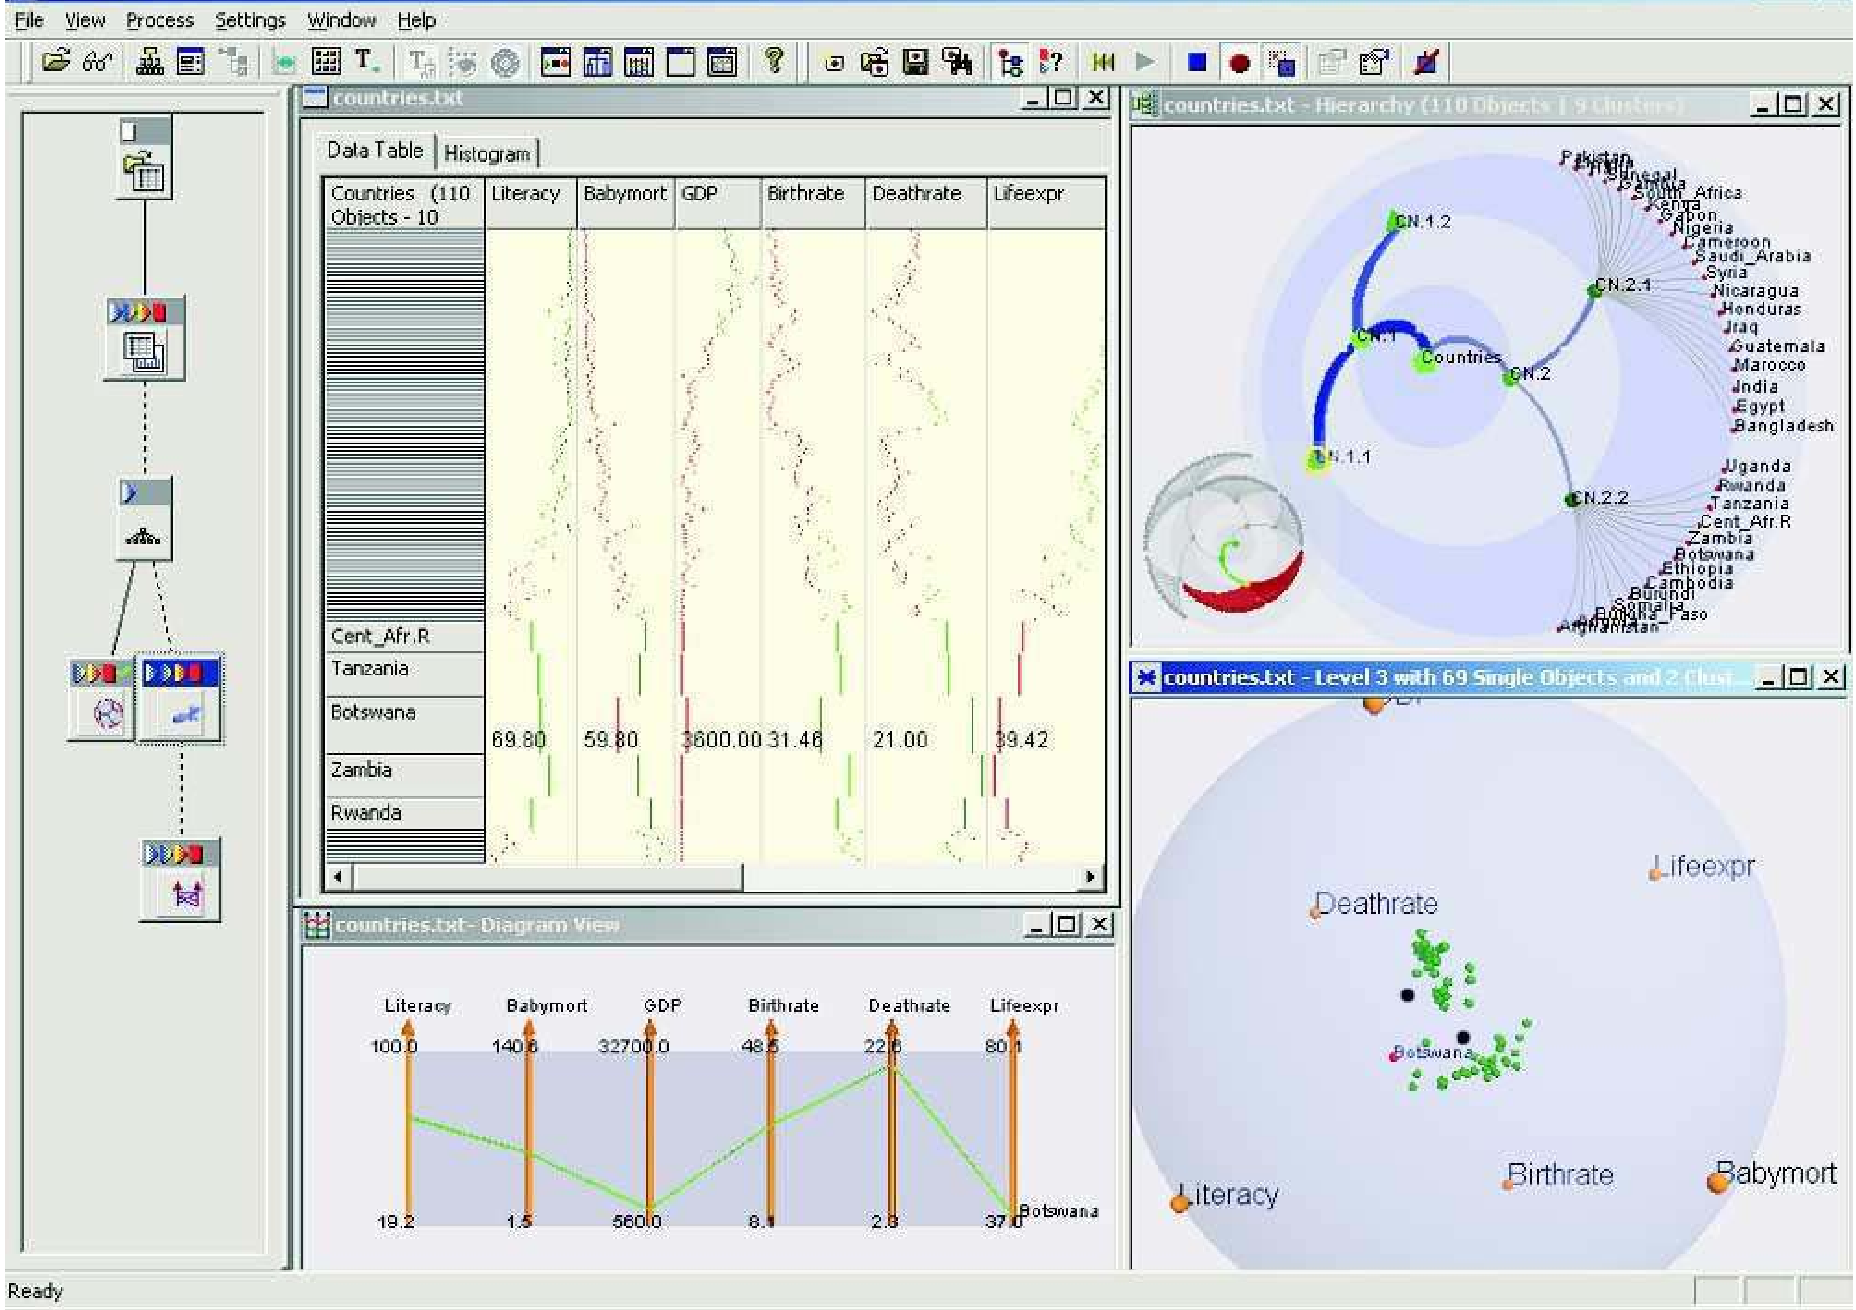
Figure 3: The InfoVis system in action, showing the history tree synchronizing multiple mining views.
Critical Insight & Conclusion
The real value of this paper lies in its treatment of the History Node as a container for metadata. By allowing users to tag nodes with specific "Exploration Tasks" or "Insights," the history tree ceases to be a mere log and becomes a Knowledge Base.
Limitations: The system faces scalability issues; as trees grow beyond 50 nodes, visual clutter becomes significant. Future work involving Focus+Context (like hyperbolic trees) or Operator Grouping (nesting multiple steps into a single logical node) will be essential for modern, high-dimensional data mining.
Takeaway
For developers of modern BI or AI-driven exploration tools, this work highlights that provenance is paramount. Providing a visual, interactive map of "how we got here" is the key to turning raw data exploration into reproducible science.