
Unmasking Social Ties in Urban Trajectories: A Homophily-Free Approach
A Homophily-Free Community Detection Framework for Trajectories with Delayed Responses
This paper introduces a four-phase community detection framework designed to infer social relationships from trajectory data with time-delayed responses. By utilizing a statistical regression model to eliminate spatial homophily, the authors successfully identified distinct taxi driver communities in Singapore that traditional simultaneous-appearance models could not capture.
TL;DR
This research addresses a fundamental flaw in trajectory-based social analysis: the confusion between genuine social following and incidental visits to popular locations (Spatial Homophily). By introducing a regression-based framework that isolates location "attractiveness" from individual "influence," the authors can detect hidden communities in taxi fleets that move in sequence rather than together.
Background: The "Popularity" Trap
In the world of Graph Mining and Trajectory Analytics, we often assume that if person A and person B appear at the same location, there is a link. However, if both A and B are at the Airport, it is likely because the Airport is a high-demand "hotspot," not because they know each other. This is Spatial Homophily. Standard algorithms fail here because they create "hairball" networks where everyone seems connected to everyone simply because they all visit downtown.
The Core Insight: Dwell Time as a Signal
The researchers from Singapore Management University pivoted from "where" people are to "how much time they spend waiting." The intuition is elegant: if subject reduces their Dwell Time (DT) (idling/search time) because subject was previously at that location, it implies subject "influenced" (perhaps via a hidden communication channel about a good passenger lead).
The Methodology
The framework operates in four distinct phases:
- Trajectory Analytics: Pre-processing raw GPS traces into origin-destination episodes.
- Graph Construction: This is the "Homophily-Free" heart of the paper. They use a linear regression model:
- : This term captures the Zone Impact (homophily). If a zone is naturally fast or slow for everyone, it is filtered out here.
- : This coefficient measures the specific impact of influencer on subject .
- Community Detection: Standard modularity maximization applied to the cleaned, directed graph.
- Interaction Hotspot Detection: Identifying where these specific community interactions (not just general popularity) occur.
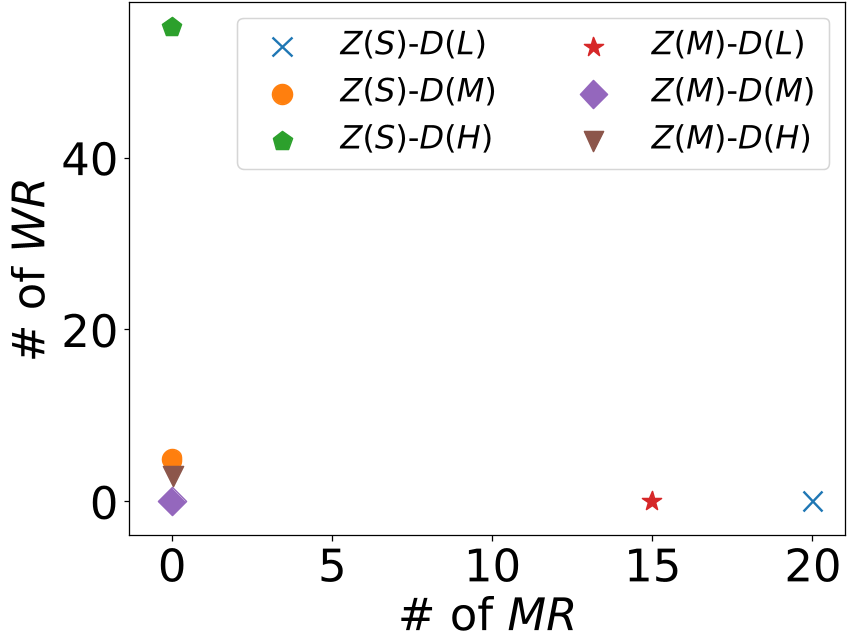 Figure 1: Performance validation showing high accuracy (low False Positives/Negatives) as demand and network size increase.
Real-World Impact: Singapore Taxi Study
The researchers tested this against a massive dataset of 6,120 taxis in Singapore. The contrast between their method and the "Baseline" (which ignores homophily) is staggering.
| Metric | Baseline (Traditional) | Proposed (Homophily-Free) |
|---|---|---|
| Edge Density | 0.4% (Too noisy) | 0.1% (Sparse/Significant) |
| Number of Communities | 8 (Too few) | 104 (Logical) |
| Average Members | 758.75 | 18.47 |
The baseline approach suggested that taxi drivers formed massive "societies" of 750 people, which is socially improbable for 2009. The proposed framework identified tight-knit groups of ~18 drivers—likely informal "kakis" (circles) who share tips about passenger demand.
Critical Insight & Limitations
The beauty of this work lies in its Inductive Bias: it assumes that social relationships in professional driving manifest as increased efficiency (reduced dwell time).
Limitations:
- Sparsity: The model struggles in low-demand scenarios (as seen in Figure 1), where there isn't enough data for the regression to reach statistical significance.
- Temporal Fixedness: The study uses data from 2009. In the modern era of Grab/Uber and Telegram groups, the nature of "delayed response" may have shifted to digital-first interactions, requiring the model to account for even longer time lags.
Conclusion
This paper provides a robust blueprint for researchers working with "dirty" location data. By treating spatial popularity as a confounding variable to be regressed away, we can finally see the true social fabric hidden within urban movement.