
HotCity: Bridging the Gap Between Maps and Urban Vitality via Social Heatmaps
HotCity: enhancing ubiquitous maps with social context heatmaps
HotCity is a cloud-based service that enhances ubiquitous public maps by overlaying social context heatmaps derived from location-based social networks (primarily Foursquare). Deployed on interactive public touchscreens (UBI-Hotspots) in Oulu, Finland, it provides tourists with real-time and historical "buzz" visualizations to aid urban exploration and activity planning.
TL;DR
HotCity is an innovative public display service that mines Foursquare and Facebook data to create Social Context Heatmaps. By overlaying real-time "human buzz" onto standard city maps, it helps tourists discover the true pulse of a city. The research proves that adding this dynamic layer doesn't overwhelm users—instead, it boosts their confidence and encourages them to explore beyond immediate tourist traps.
Problem & Motivation: The "Static Map" Limitation
When you arrive in a new city, a map tells you where things are, but it rarely tells you when a place is worth visiting. Is that restaurant popular with locals, or is it a "ghost town" on Wednesday afternoons?
Traditional guides are static. Mobile apps require data roaming. The researchers identified a gap in Ubiquitous Computing: the need for public interactive displays that reflect the collective social identity and current "vibe" of an urban environment. Their insight was to treat social media check-ins not just as data points, but as a middle layer of environmental context that complements physical maps.
Methodology: Layering the "Social Buzz"
The HotCity architecture is built as a cloud-based service that aggregates data from Foursquare, Facebook, and Google Places. The core technical contribution is the Three-Layer Visualization Model:
- Layer 0 (Background): The standard cartographic city map for spatial orientation.
- Layer 1 (The Heatmap): A spatiotemporal layer representing check-in density. Users can adjust time/day sliders to see how the "social buzz" shifts from a Monday morning to a Friday night.
- Layer 2 (The Social POI): Individual points marked with "flame" icons for historical popularity and real-time numbers showing current check-ins.
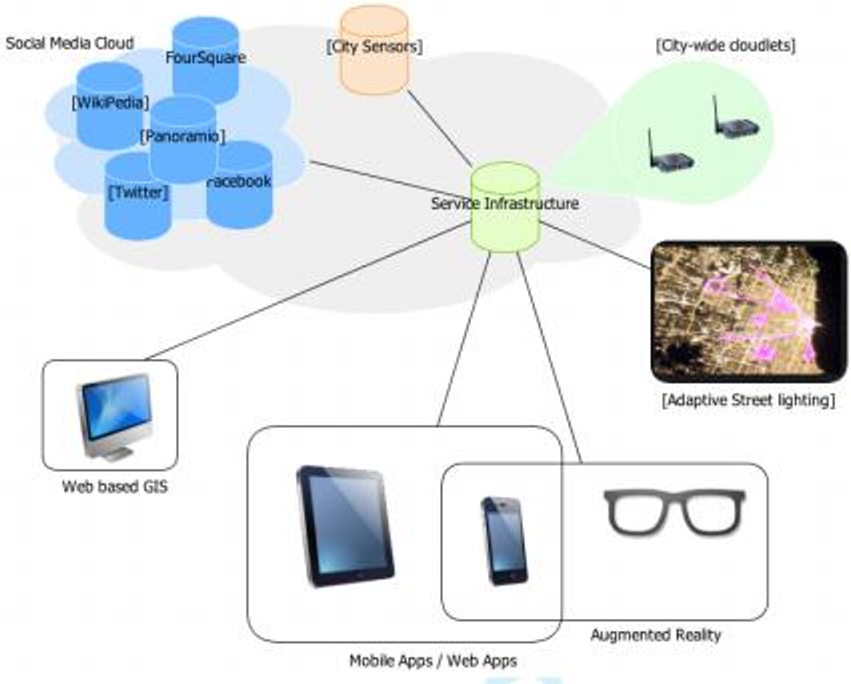 Figure 1: The HotCity system harvests data from social APIs to push dynamic context to public displays.
The researchers set up "listening posts" across Oulu, Finland, querying APIs every 30 minutes to capture the ebb and flow of the city's inhabitants.
Experiments: Measuring Confidence and Exploration
The team conducted a between-subjects study on "UBI-Hotspots"—large, outdoor touchscreen kiosks. Participants were tasked with finding landmarks, restaurants, and nightlife spots under specific scenarios.
Performance vs. Perception
Interestingly, the heatmap did not significantly speed up task completion. However, it radically changed the User Experience (UX).
- Higher Confidence: Users with access to heatmaps felt significantly more certain that they were making "the right choice."
- Exploratory Behavior: Using a spatial analysis technique called "Convex Hull," the researchers found that heatmap users were willing to consider venues across a much wider geographic area. The visual "glow" of the heatmap acted as a lure, overcoming the natural tendency to stay in one's immediate vicinity.
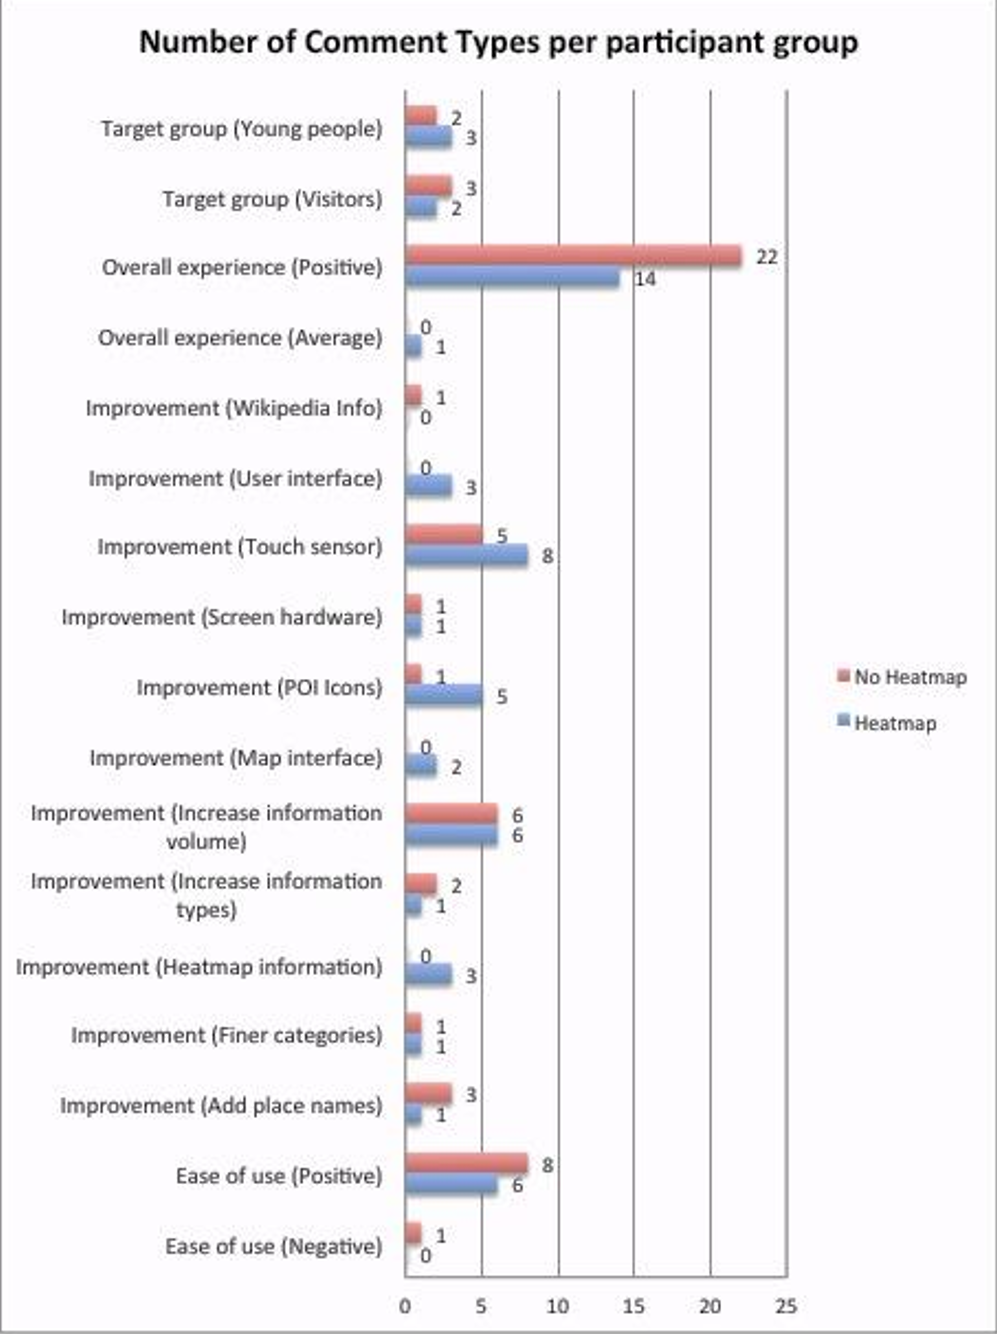 Figure 2: Convex hull analysis showing that heatmap users (Right) explored a larger area of the city compared to the control group (Left).
Critical Analysis & Conclusion
HotCity successfully demonstrates that Social Context is a viable and useful layer for ubiquitous maps.
Key Takeaways:
- Heatmaps as Cognitive Shortcuts: By using heatmaps as a background/middle layer, researchers avoided "icon clutter," allowing users to absorb the "vibe" of an area at a glance without losing sight of the streets.
- The Power of Names: A surprising qualitative finding was that users value venue names almost as much as location. The lack of visible labels on icons was a major friction point, suggesting that "Identity" is as important as "Geography."
- Platform Matters: Even a perfect app can be hindered by hardware. Reflections on glass and inconsistent touch sensors on the UBI-Hotspots were noted as significant barriers to the "magic" of the experience.
The Future: AR and Mobile
The work isn't stopping at kiosks. The authors are already pivoting toward Augmented Reality (AR), where users can point their phones at a static physical map and see the digital heatmap come to life—a perfect blend of the traditional and the digital.
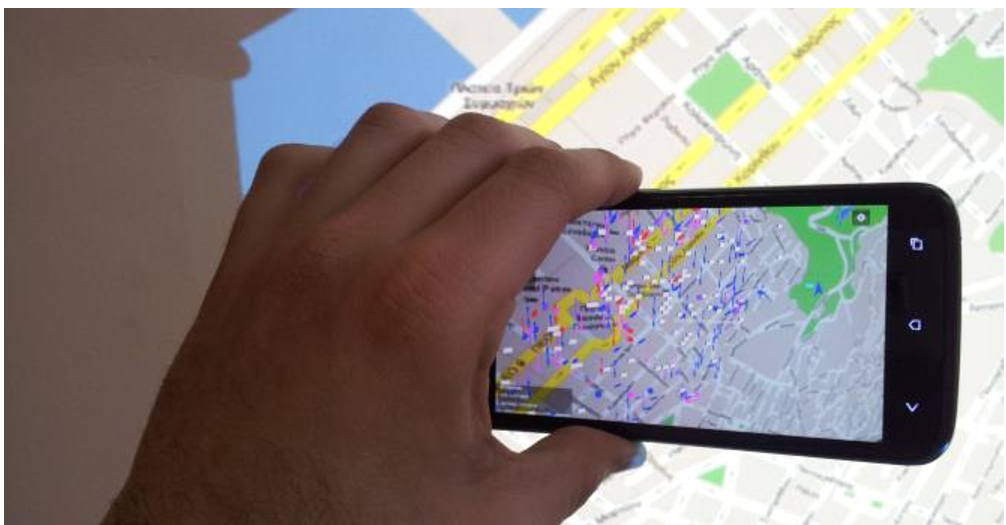 Future Vision: Using AR to overlay HotCity data on static paper maps.
HotCity serves as a blueprint for "Smart City" interfaces, proving that the most valuable map data isn't just where a building stands, but who is in it and when.