
Beyond the Balance Sheet: Identifying "Hidden Champions" Through Supply Chain Social Computing
Identifying Highly Potential Enterprises with Social Computing on Supply Chain Networks
This paper proposes an Extended Balanced Scorecard (EBSC) framework that integrates Social Network Analysis (SNA) with traditional performance metrics to identify "hidden champions"—highly potential enterprises within supply chain networks. By analyzing the "Betweenness Centrality" of business items, the authors quantify an enterprise's influence and access to information within a complex industrial network.
TL;DR
Can we identify the next global market leader before their financial statements reflect their success? This paper argues that the secret lies in the Supply Chain Network. By extending the traditional Balanced Scorecard (BSC) with Social Network Analysis (SNA), the authors introduce the Extended Balanced Scorecard (EBSC). This model uses "Betweenness Centrality" within business item networks to pinpoint "Hidden Champions"—SMEs that dominate specific niches but remain under the radar of traditional financial analysis.
Background Positioning: This work bridges the gap between traditional management science (BSC) and modern data science (SNA), positioning network topology as a primary determinant of corporate "potential."
The Problem: The Financial "Blind Spot"
Most investors and governments look at ROA (Return on Assets) or ROE (Return on Equities) to judge a company. However, these are "rear-view mirror" metrics. In a knowledge-based economy, a company's strength isn't just what it owns, but whom it knows and where it sits in the flow of information.
The authors argue that:
- Financial metrics are insufficient: They fail to capture the "opaque" nature of industrial dependencies.
- Traditional BSC is incomplete: While it looks at customers and internal processes, it treats the enterprise as an isolated island rather than a node in a vast, interconnected network.
Methodology: Mapping the Invisible Network
The core innovation is the construction of a Main Business Item Network. Since real supply chain relationships are often trade secrets, the authors use a proxy: Registered Business Items.
1. The Inference Logic
If Enterprise A and Enterprise B share or are linked through specific, high-value business categories (like "computer peripheral manufacturing"), their relationship is modeled as a tie in a social graph.
2. Betweenness Centrality as a Proxy for Power
The authors use mathematical centrality to measure "brokerage" power. In plain English: If a company's business activities lie on the shortest path between many other industries, that company is a gatekeeper. It has the highest "Betweenness," giving it disproportionate access to market trends, innovative ideas, and scarce resources.
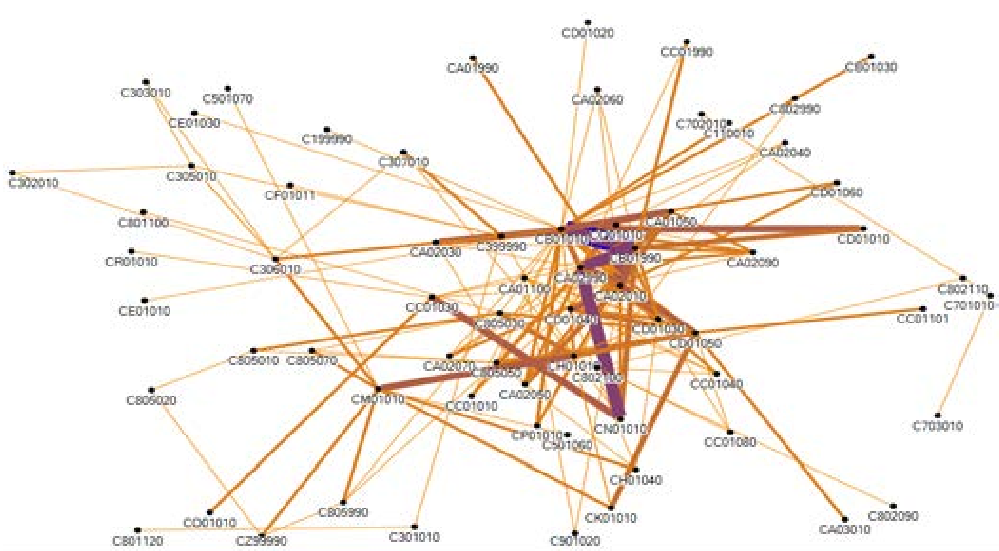 Figure 1: Visualization of the Main Business Items Network, showing the interconnectedness of industrial categories.
Experiments & Results: EBSC vs. The World
The researchers tested four scenarios against a "Ground Truth" list of high-potential firms provided by the Industrial Development Bureau (IDB) of Taiwan:
- Scenario 1 & 2: ROA/ROE Rankings.
- Scenario 3: Traditional 4-Perspective BSC.
- Scenario 4: The proposed 5-Perspective EBSC (Extended BSC).
The Verdict: As shown in the charts below, rankings based on ROA and ROE (Fig 2) showed massive variance from the actual high-potential list. The EBSC model (Fig 3b), however, showed the highest alignment with the IDB's expert evaluation.
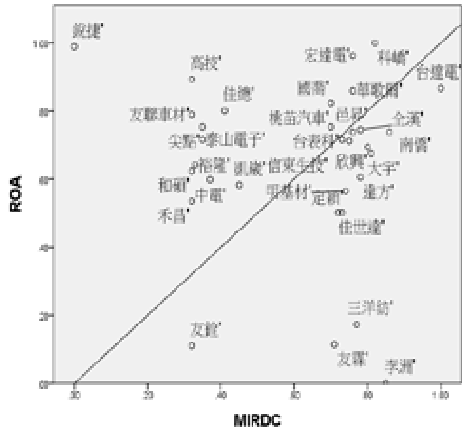 Figure 2: Financial metrics (ROA/ROE) fail to accurately rank high-potential enterprises.
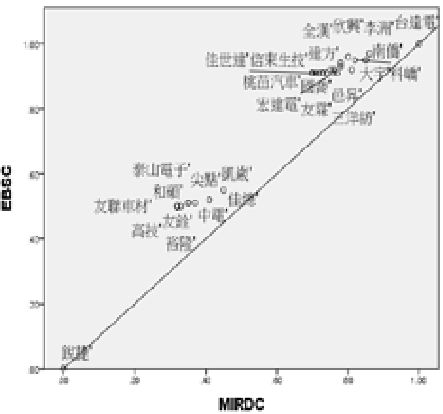 Figure 3: The EBSC model significantly outperforms traditional methods by incorporating network position.
Critical Insights & Future Outlook
Deep Insight: Network as an "Informal Asset"
The genius of this paper is treating an enterprise’s "Supply Chain Position" as an informal asset, akin to human capital. For SMEs in Taiwan (and globally), they cannot outspend multinationals on R&D, but they can out-maneuver them by occupying "Structural Holes" in the supply chain—acting as indispensable bridges between larger nodes.
Takeaway for Decision Makers
- For Investors: Stop looking only at the P&L. Ask: "If this company disappeared, how many supply chains would break?"
- For Policy Makers: Use social computing to identify these "Hidden Champions" for subsidies, as they are the true engines of industrial upgrading.
Limitations
The model relies on "Main Business Items," which are static registrations. A more dynamic model would incorporate real-time transaction data or shipping manifests to create a live "heat map" of industrial influence.
Conclusion: This research proves that in the modern industrial landscape, your Network is your Net Worth.