
Identifying Market Leaders: A Social Network Analysis of Global Stock Indices
Identifying influential stock indices from global stock markets: A social network analysis approach
This paper introduces a Social Network Analysis (SNA) framework to identify and rank influential global stock indices using correlation networks and Minimum Spanning Trees (MST). By analyzing 93 indices over the 2006-2010 period, it demonstrates how centralities can pinpoint "market leaders" and track shifts in global financial integration during the Lehman Brothers crisis.
TL;DR
Researchers have moved beyond simple market cap to rank the world's most influential stock indices using Social Network Analysis (SNA). By analyzing the "co-movement" of 93 global indices during the 2008 financial crisis, the study reveals that European indices are the true hubs of global market connectivity, and that financial crises trigger a massive "synchronization" effect where markets move in lockstep.
Context: Why Network Topology Matters
Traditional finance monitors price series in isolation. However, the 2008 collapse of Lehman Brothers proved that the global market is a "complex system" where a failure in one node propagates through invisible threads of correlation. This paper treats stock indices like actors in a social network, asking: Who is the "influencer" that everyone else follows?
Methodology: Mapping the Financial Web
The authors construct a correlation network where an edge exists between two indices only if their weekly returns show a high correlation (threshold ). To filter out the "noise" and find the essential backbone of the market, they derive a Minimum Spanning Tree (MST).
The "Influence" Multi-Tool
Instead of relying on a single metric, the study uses a composite of seven centrality measures:
- Degree Centrality: Who has the most direct connections?
- Betweenness: Who acts as the "bridge" between different regional clusters?
- Closeness: Who is the "closest" to all other markets on average?
- Eigenvector Centrality: Who is connected to other important indices?
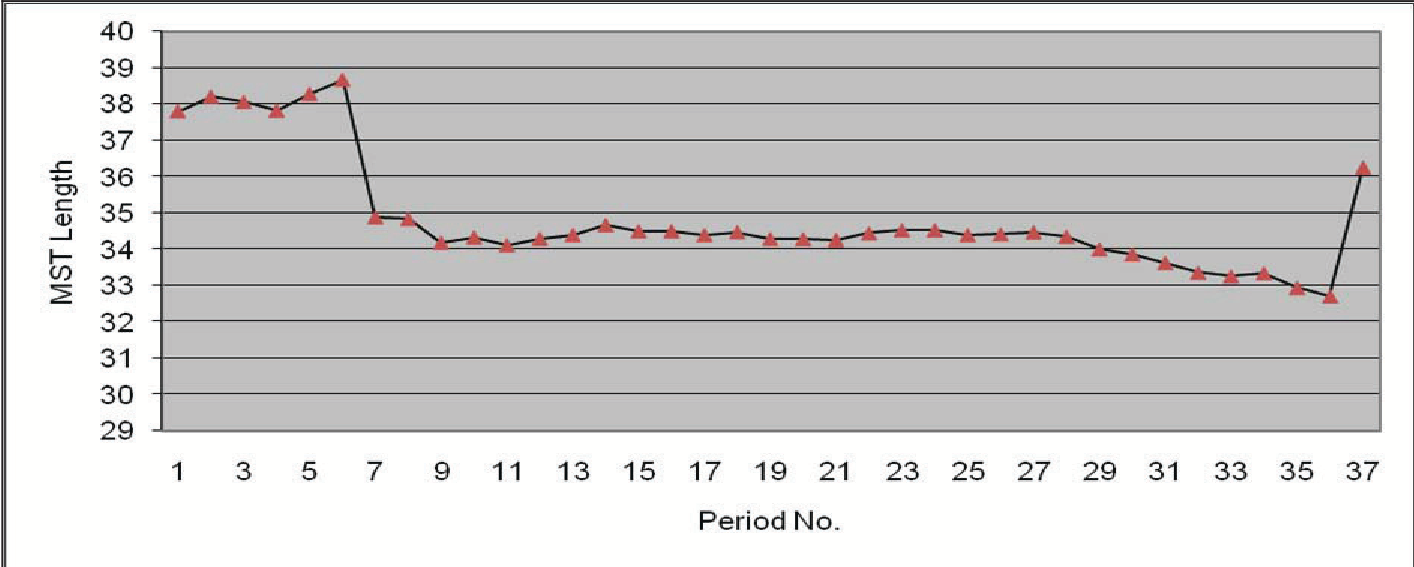 Figure 1: The shrinking length of the MST captures the onset of the 2008 crisis, signaling heightened global synchronization.
Key Insights from the 2008 Crisis
1. The "Synchro" Effect
As visualized in the MST length graph, the physical "distance" between global markets collapsed following the Lehman Brothers event. In tranquil times, markets are loosely coupled; in a crisis, they synchronize. This makes international diversification much harder, as all "eggs" effectively end up in one correlated basket.
2. Europe as the Global Hub
Counter-intuitively, the most influential indices were not always the US majors (like the S&P 500), but European indices like the SXXP (STOXX Europe 600) and SXXE (Euro Stoxx). These indices occupied the central positions in the network, acting as the primary transmitters of market sentiment.
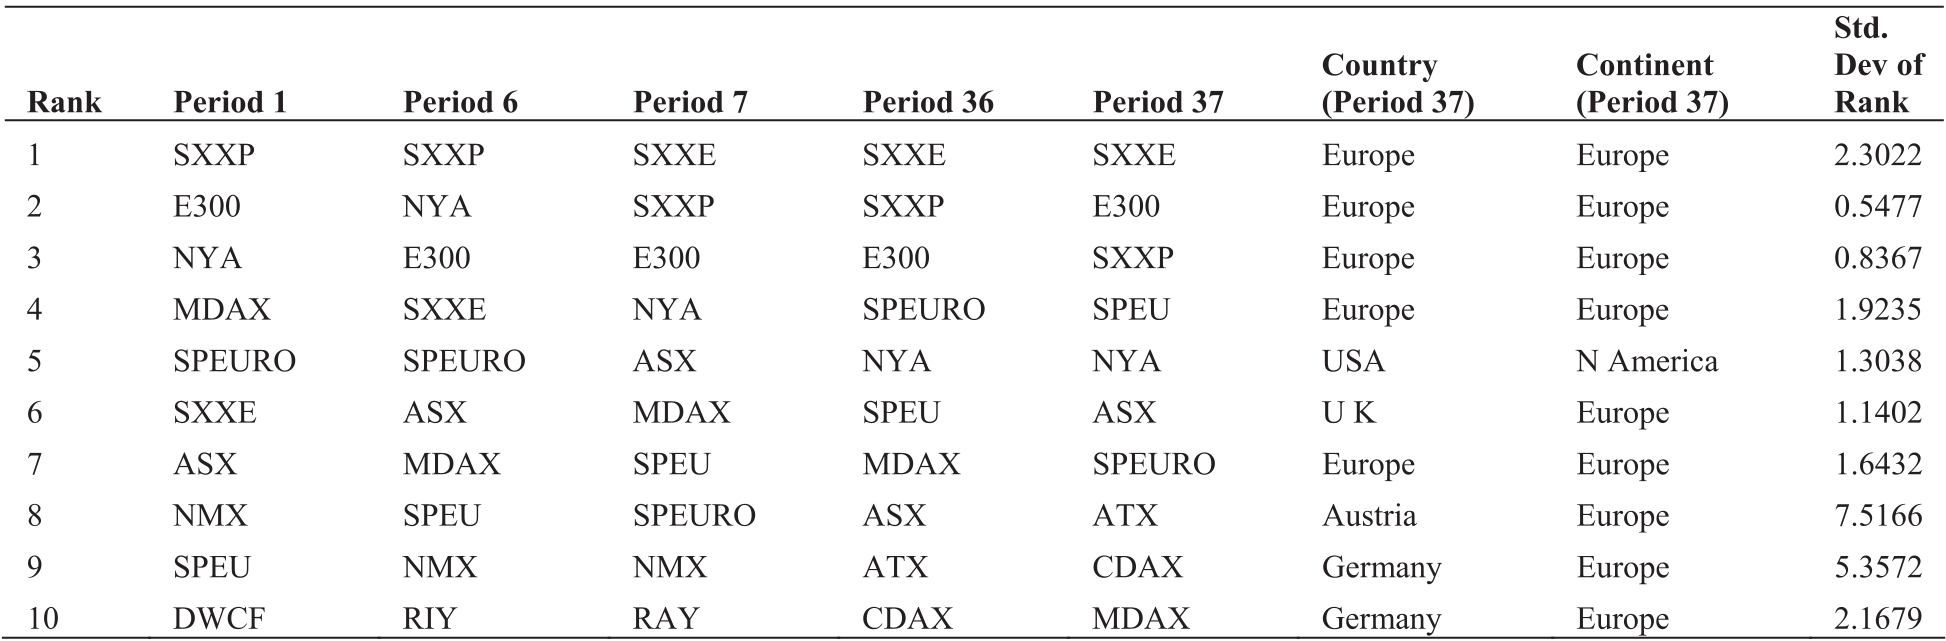 Table 1: Ranking of indices across different periods. Notice the consistency of European dominance (SXXP/SXXE).
3. Regional Resilience: The Case of India
The study highlights a fascinating shift for the Indian Sensex. Before the crisis, it clustered with European indices. After the crash, it moved toward Asian clusters, suggesting a decoupling from Western volatility and a high level of resilience.
Analysis: Why This Works
The brilliance of this approach lies in its ability to see "Emergent Behavior." By ignoring the size of the fund and looking at the topology of interactions, the researchers identified that trade linkages and geographical proximity (especially in Europe) create a dense core that dictates global movement.
Conclusion & Future Outlook
This work provides a roadmap for Early Warning Systems. By monitoring the MST length and the stability of centrality rankings, regulators can detect when a market is becoming "too synchronized" to be safe.
Limitations: The study relies on weekly returns, which may smooth out high-frequency "flash crash" dynamics. Future research could integrate Dynamic Conditional Correlation (DCC) or machine learning to predict shifts in these network hubs in real-time.
Takeaway for Investors: Don't just look at the ticker; look at the network. If your "diversified" portfolio is connected to a central hub like the SXXP, you might be more exposed to global contagion than you think.