
CEC Model: Rethinking Social Influence via Electrical Conductance
Identifying social influence in complex networks: A novel conductance eigenvector centrality model
This paper introduces the Conductance Eigenvector Centrality (CEC) model, a novel framework for identifying influential nodes in social networks by treating the network as a conductance-based electrical circuit. The method leverages a stable random walk mechanism on a conductance matrix to outperform traditional benchmarks like PageRank and Betweenness Centrality.
TL;DR
The paper proposes the Conductance Eigenvector Centrality (CEC) model, treating social networks as electrical circuits to measure peer influence. By considering all possible paths between users and modeling "resistance" as distance, it provides a significantly more accurate ranking of influential peers—especially the top 10% critical for business marketing—than standard PageRank or Degree Centrality.
Problem & Motivation: The Failure of "Local" Intuition
In social network analysis, identifying the "leaders" is crucial for viral marketing. However, existing metrics have blind spots:
- Degree Centrality: Biased toward nodes on the "border" of the network that may have many connections but little central reach.
- Betweenness Centrality: Obsessed with the shortest paths, ignoring that influence often flows through "noisy" or redundant secondary paths.
- PageRank: Often treats all outbound links equally, failing to account for the structural "resistance" of the paths themselves.
The authors argue that true influence is a global phenomenon. Like electricity spreading through a grid, it doesn't just take the highway; it permeates every available wire, losing "voltage" as it travels further.
Methodology: The "Conductive" Network
The CEC model transforms a standard adjacency matrix into a Conductance Matrix ().
1. The Physics of Influence
The model assumes:
- Multiple Paths: Every path distributes influence.
- Distance equals Resistance: Longer paths have higher resistance (), resulting in lower influence retention.
- Global Perspective: A node's influence is the sum of its "energy" reaching all other nodes after considering the entire network's topology.
2. Architecture & Mathematical Core
The technical workflow starts with the Graph Laplacian . The core innovation involves calculating the Moore-Penrose inverse () to derive the resistance between nodes: The conductance is then . Finally, the model uses a Random Walk mechanism to find the stable state, which is mathematically proven to be the principal eigenvector of the normalized conductance matrix.
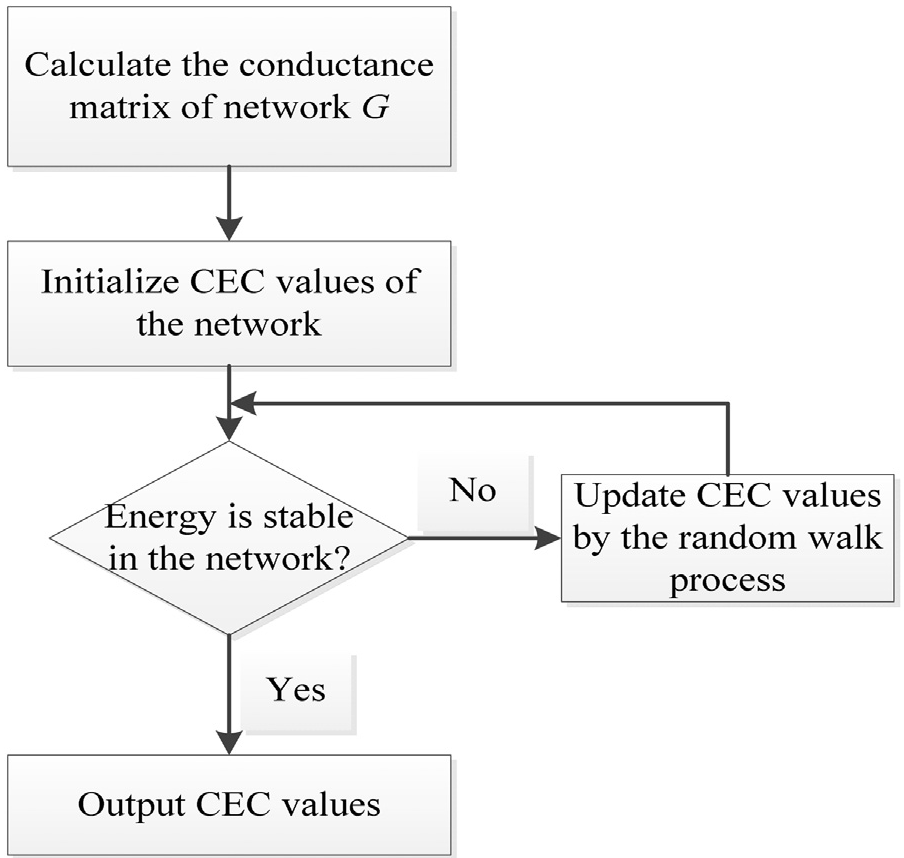 Figure 1: The solution framework of the CEC model integrating random walks with conductance.
Experiments & Results: SOTA Performance in Clustered Networks
The researchers tested CEC against the SIR model (the gold standard for infection/influence simulation) across several datasets, including the Netscience and Blogs datasets.
Key Performance Identifiers:
- Robustness in Clusters: CEC excels when the Clustering Coefficient is high. Because it accounts for all paths, it naturally captures the "redundant" influence present in tight-knit groups that PageRank misses.
- Top-Tier Accuracy: For business applications, identifying the top 10% of influencers is vital. CEC showed a massive 46.59% accuracy improvement on the BrightKite network for this specific segment.
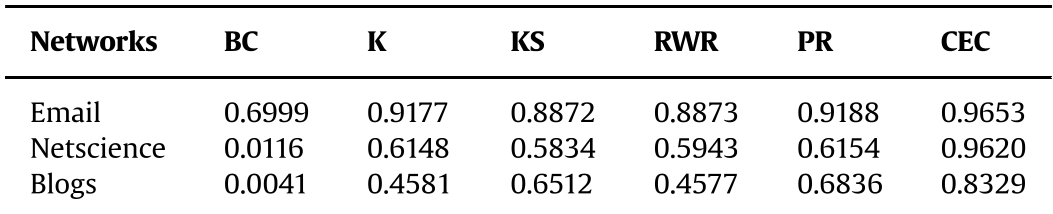 Table 1: Correlation coefficients between various centralities and SIR influence. CEC consistently leads.
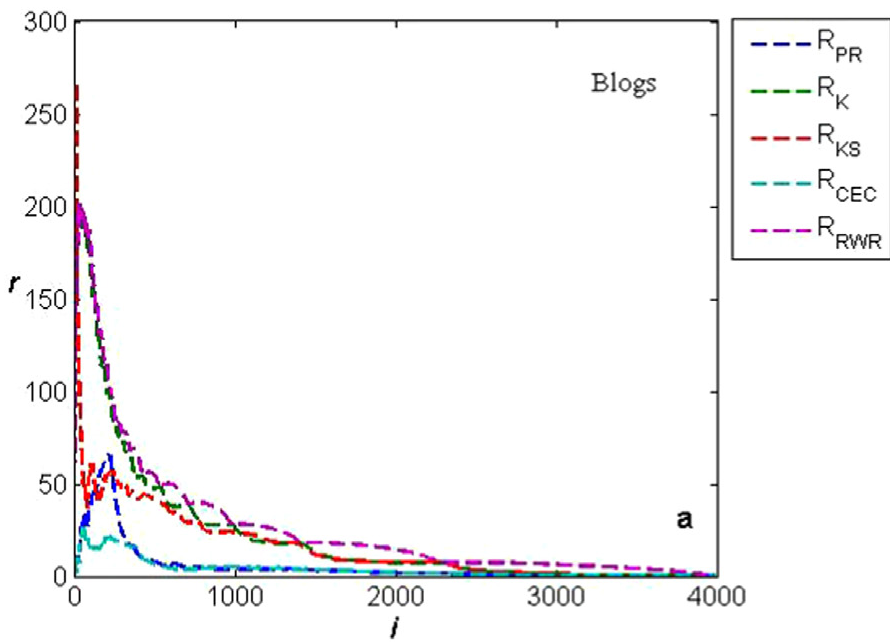 Figure 2: Comparison of ranking performance across Email, Netscience, and Blogs networks.
Critical Analysis & Conclusion
The "Top 10%" Takeaway
The most striking result of this paper is the Division-CEC-Adjustment strategy used for massive networks like BrightKite (58k nodes). By dividing the complex graph into sub-networks and applying a weighted CEC formula, the authors proved that conductance-based metrics are scalable and highly effective for "Global Influence" approximation.
Limitations
While mathematically elegant, the calculation of the Moore-Penrose inverse of a Laplacian matrix is computationally expensive for extremely dense, billion-node graphs. Future work likely needs to explore approximation algorithms or distributed computation frameworks to maintain this "Conductance" edge at a Facebook scale.
Final Thoughts
The CEC model serves as a reminder that path redundancy is a feature, not a bug, in social influence. By replacing the "shortest path" obsession with "electrical conductance," we gain a much clearer view of the actual power dynamics in complex human networks.