
IdeoTrace: Quantifying the Widening Chasm of Polarization on Social Media
IdeoTrace: A Framework for Ideology Tracing with a Case Study on the 2016 U.S. Presidential Election
The paper introduces IdeoTrace, a matrix factorization-based framework designed to jointly estimate the political ideology of social media users and news websites. By incorporating temporal dynamics and social network graphs, it tracks the evolution of user polarization over time, specifically during the 2016 U.S. Presidential Election.
TL;DR
Researchers from Rice and UMass Amherst have developed IdeoTrace, an unsupervised framework that leverages matrix factorization and social network topology to map the ideological drift of users. By analyzing Twitter data from the 2016 U.S. Election, the study proves that polarization isn't just a baseline state—it is a dynamic process that intensified by nearly 3.5% in the weeks leading up to Election Day.
Context: The Digital Echo Chamber
The 2016 U.S. election was a watershed moment for social media's role in democracy. While it's well-known that "fake news" and trolls exacerbated divisions, the scientific community lacked a scalable way to measure how much users' views changed over time. The primary challenge? Political ideology is a "latent" variable—users don't usually wear a label, but their behavior (what they share) and their network (who they follow) reveal their bias.
Methodology: The Math Behind the Bias
IdeoTrace treats the act of sharing a news link as a signal in a latent space. The core intuition is simple: if a user's ideology vector aligns closely with a website's ideology vector, the probability of a share increases.
1. The Interaction Model
The probability () is modeled as:
u_{j})$$ Where $\mathbf{w}_i$ is the website's bias, $\mathbf{c}_j$ is the user's bias, and $\mu, u$ represent popularity and activity levels. ### 2. Constraints: Homophily and Persistence The model adds two critical academic "prior" beliefs to the optimization: * **Graph Penalty (Homophily):** Uses a Laplacian matrix ($\mathcal{L}_R$) derived from the retweet network. If User A retweets User B, the model penalizes the distance between their estimated ideologies. * **Temporal Penalty:** Prevents erratic jumping. A user's ideology at Tuesday should logically be close to their ideology on Monday unless the evidence for a shift is overwhelming. 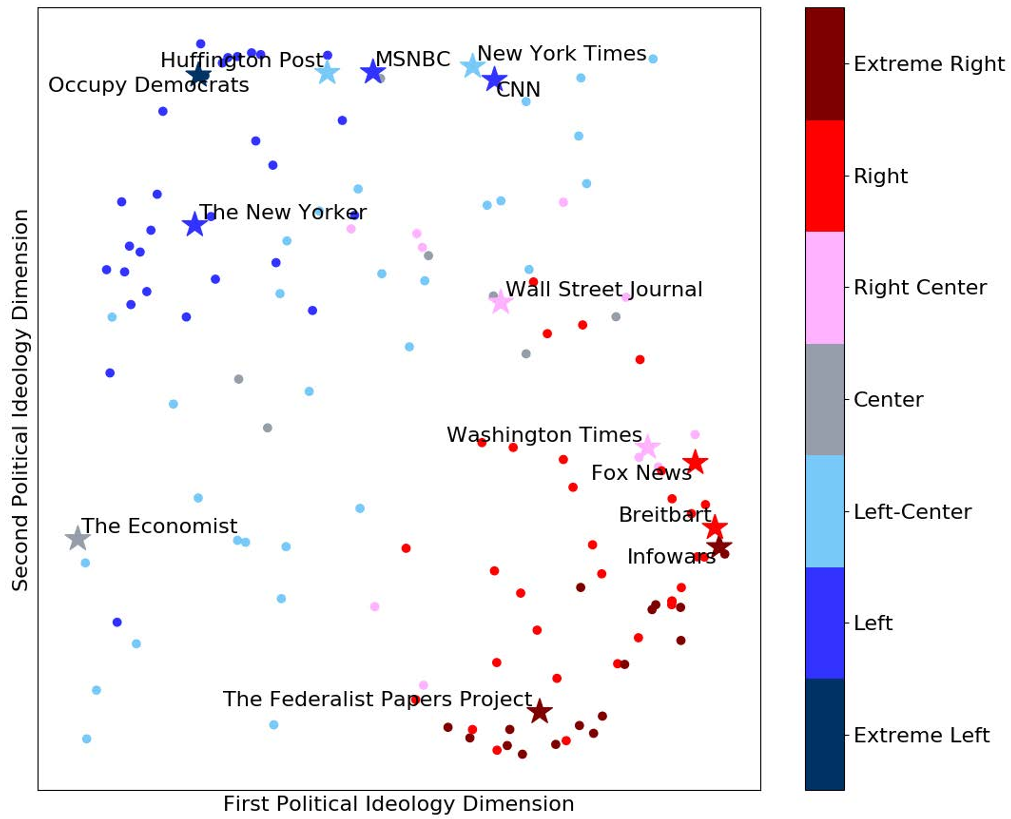 *Fig 1: Latent space visualization showing a clear bifurcation between Liberal (left) and Conservative (right) news media clusters.* ## Experimental Insights: The Polarization Trend The researchers applied IdeoTrace to a dataset of roughly 47,000 users. The results were stark: * **Accuracy:** The model's unsupervised estimates for websites like *The New York Times* or *Fox News* aligned with expert labels at a correlation of 0.87. * **Drift toward Extremes:** Between September and November 2016, the distance between the "Liberal" and "Conservative" cluster centers grew by **3.43%**. 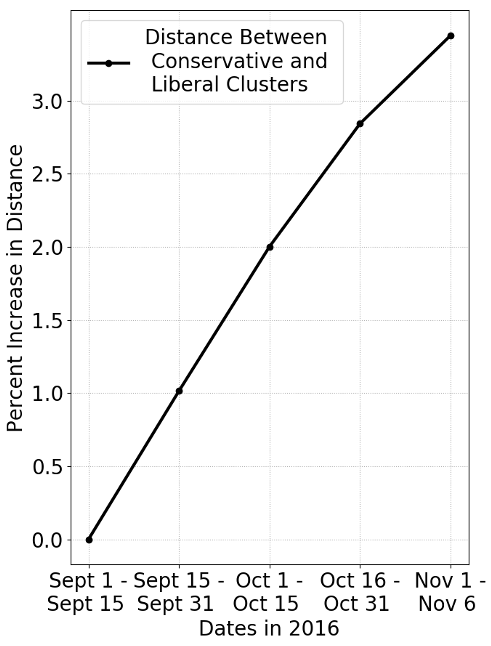 *Fig 2: Temporal growth of the distance between ideological clusters, indicating a steady rise in polarization leading to the election.* ## Critical Analysis & Conclusion IdeoTrace's strength lies in its **unsupervised nature**. It doesn't need to read the content of articles (which is computationally expensive or prone to NLP errors); it only needs to know *who* shared *what* and *who* retweeted *whom*. **Limitations:** * **Data Attrition:** Because the study relied on the Twitter API years after the event, many accounts (including known Russian trolls/bots) were already deleted, potentially underestimating the true level of manipulation. * **Dimensionality:** The paper uses $K=2$ dimensions for interpretability. In a more complex geopolitical landscape, a higher-dimensional latent space might be necessary to capture nuance (e.g., Libertarian vs. Authoritarian). **Future Outlook:** As social media platforms face pressure to implement "interventions" (like recommending diverse content), IdeoTrace provides a vital barometer. It allows us to ask: *Do these interventions actually reduce the 3.43% drift, or do they push users further into their shells?* This framework is a necessary step toward move from qualitative "worry" about social media to quantitative measurement of its impact on the collective psyche.