
Inferring Hidden Communities: A Centrality-Based Approach to Seed-Set Expansion
Inferring Community Members in Social Networks by Closeness Centrality Examination
2012-11-01
Summary
Problem
Method
Results
Takeaways
Abstract
This paper introduces a Closeness Centrality Examination algorithm to infer hidden community members in social networks based on a set of known members. The method utilizes a weighted graph model where edge weights are determined by the sensitivity of message topics, subsequently identifying remaining members through hierarchical clustering and outlier analysis.
## TL;DR
This research provides a systematic method for finding "the rest of the group" in social networks when you already know a few members. By combining **Text Analysis** (to weight connections) with **Closeness Centrality** (to measure proximity to a known core), the authors present a way to mathematically pinpoint hidden members using hierarchical clustering.
## Problem & Motivation
In digital forensics and social analysis, we rarely start from scratch. Often, investigators have a few "known associates" and need to find the remaining members of a hidden group.
The technical challenge is twofold:
1. **Static Graphs are Blind**: Most community detection algorithms treat all connections equally. In reality, a message about a sensitive topic is a much stronger indicator of community ties than a generic greeting.
2. **The "Seed" Problem**: Standard clustering might overlook the specific influence of the known members (the seeds). There is a need for a metric that specifically measures "distance to the known core."
## Methodology: The Core Mechanism
### 1. Topic-Sensitive Weighted Graphs
Instead of a simple binary connection, the authors use text analysis to assign weights.
- **Sensitive Words**: Divided into *strong* and *weak* categories.
- **Edge Weighting**: High sensitivity in message topics creates a "stronger" (shorter) path between nodes in the graph.
### 2. The Central Subtree & Closeness Centrality
The known members are treated as a **Central Subtree**. To find new members, the algorithm calculates a modified Closeness Centrality score ($C_c$):
$$C_c = \frac{1}{\sum_{i=1}^{m} d_i}$$
Where $d_i$ is the shortest path from an external node to each node $i$ in the known central subtree (calculated via the **Floyd-Warshall** algorithm). A lower score indicates a node is structurally and contextually closer to the community core.
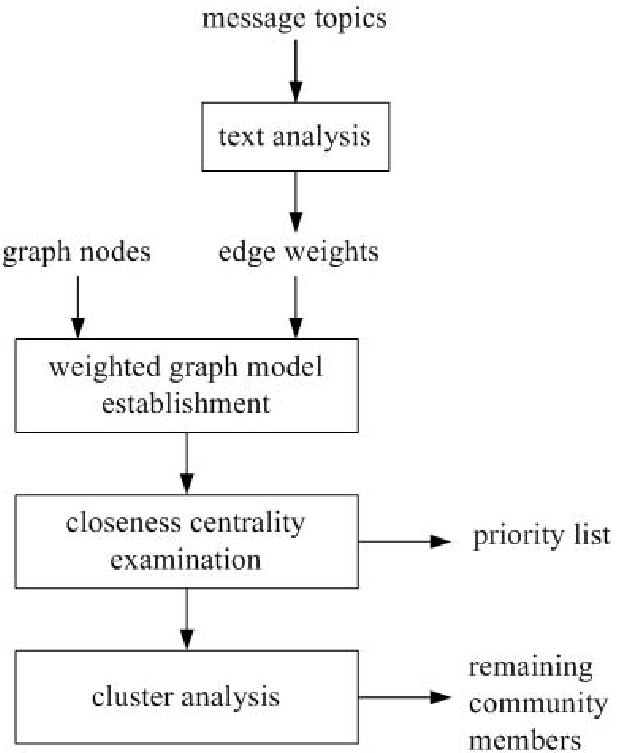
*Fig 1: The three-step process: Graph Establishment, Centrality Examination, and Cluster Analysis.*
## Experiments & Results
The authors tested their model on a network of 38 members.
### Case Analysis
- **Case 1 (3 Seeds)**: Identified nodes 15, 23, and 35 as the most suspicious. A significant "jump" in relative centrality (38%) at Node 18 served as the natural boundary for the community.
- **Case 2 (5 Seeds)**: By adding nodes 6 and 32 to the known set, the algorithm became more sensitive, bringing Node 13 into the identified community.
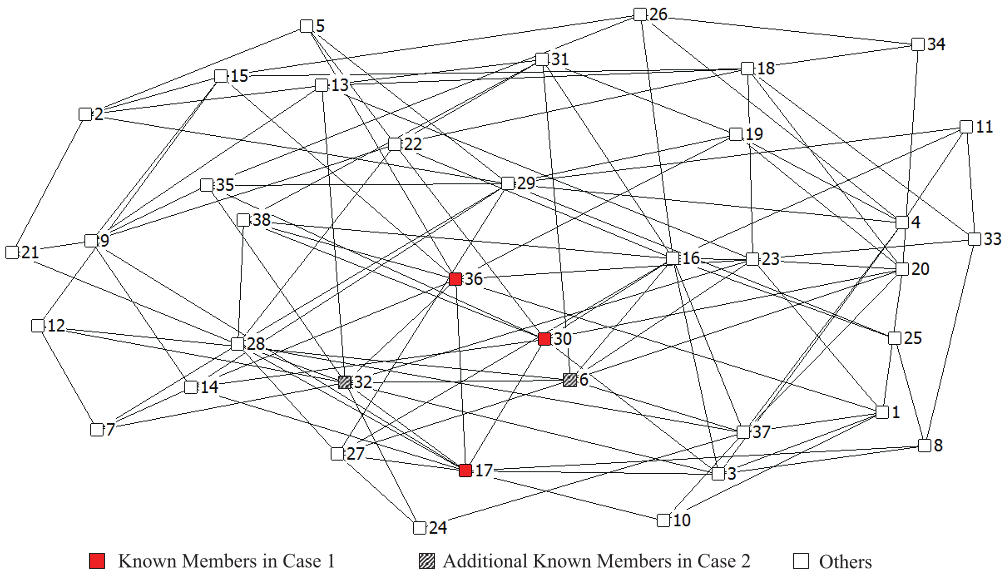
*Fig 2: Ranked closeness scores for Case 1. The steep incline after the initial nodes indicates the boundary between community members and outsiders.*
### Clustering Logic
Using **Agglomerative Hierarchical Clustering** with average linkage and Euclidean distance, the authors visualized the community structure. The "outlier" in centrality scores effectively acts as a threshold, separating the hidden group from the general population.
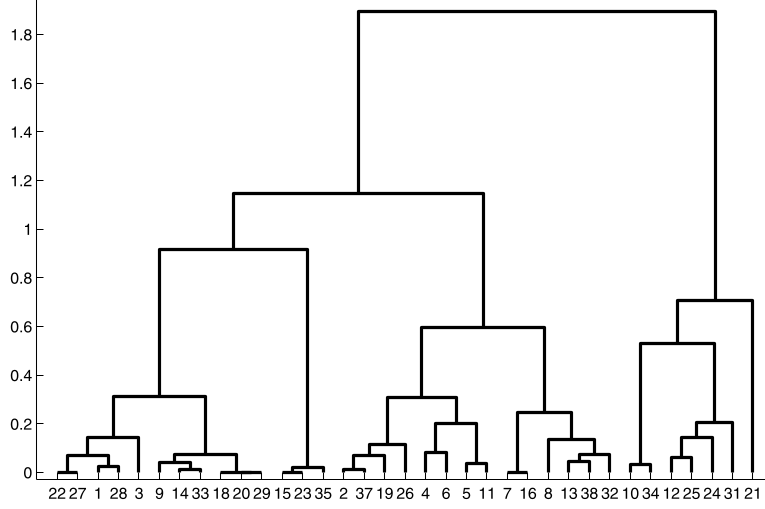
*Fig 3: Dendrogram of Case 2, showing how members are grouped based on their centrality distances.*
## Critical Analysis & Conclusion
The strength of this work lies in its **simplicity and interpretability**. Unlike "black-box" deep learning models, the use of Floyd-Warshall and Closeness Centrality provides a clear audit trail for why a specific node is considered "suspicious."
**Limitations**:
- **Computational Complexity**: Floyd-Warshall is $O(n^3)$, which limits this method to small or medium-sized networks (a few thousand nodes). For massive social networks, a more efficient shortest-path approximation would be required.
- **Weight Sensitivity**: The results are highly dependent on the quality of the "sensitive word" dictionary used in the initial text analysis.
**Final Takeaway**:
This paper demonstrates that by anchoring graph analysis to a "known core" (Central Subtree), we can significantly improve the accuracy of community inference tasks, providing a high-value tool for targeted social network investigations.