
Beyond Zipf: Decoding Content-Centric Traffic through Geo-Social Lens
Inferring content-centric traffic for opportunistic networking from geo-location Social Networks
This paper proposes a framework to infer content-centric traffic patterns for opportunistic networks using Geo-location Social Networks (LBSNs). By analyzing check-in data from Foursquare and Gowalla, it identifies that content popularity follows Power-law or Gamma distributions depending on the context, providing empirical models for mobile data offloading and content sharing.
Executive Summary
TL;DR: This paper bridges the gap between social behavior and network engineering by using Foursquare and Gowalla check-in data to model traffic demand in opportunistic networks. It identifies that content demand is not a "one-size-fits-all" Zipf distribution but varies significantly between location-based and context-based applications, following Generalized Pareto and Gamma distributions respectively.
Positioning: This work serves as a foundational empirical study, moving away from purely theoretical traffic assumptions towards data-driven modeling for content-centric networking (CCN) and mobile data offloading.
Motivation: The Data Scarcity in Opportunistic Networking
Opportunistic networking—where devices exchange data via Bluetooth or WiFi Direct—relies on the "right" density of interested users. However, since massive-scale opportunistic deployments are rare, researchers have historically "borrowed" traffic models from the Web or P2P networks (typically Zipf-law distributions).
The author's Insight is simple yet profound: opportunistic networking is inherently local and social. Therefore, Location-Based Social Networks (LBSNs) offer a "proxy" for real-world traffic demand, connecting where a user is with what they might want to consume.
Methodology: Mapping Social Check-ins to Data Demand
The study analyzes two massive datasets:
- Foursquare: 2.4M venues across 14 regions.
- Gowalla: 350k users and 27M check-ins.
The authors split popularity into two types:
- Location-based (Venue-level): Finer grain, representing local interest (e.g., a local event map).
- Context-based (Category-level): Coarser grain, grouping venues like "Gyms" or "Theaters" to represent topical content interest.

Core Findings: The Distribution Shift
The research reveals a critical distinction in how content interest is distributed:
1. The Pareto of Places
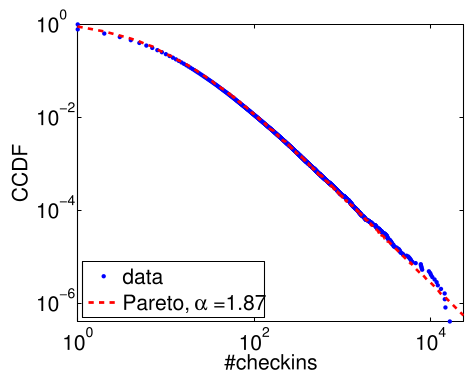
For location-based content, the demand follows a Power-law (Generalized Pareto) distribution.
- Large Scale: Highly skewed ( between 1.2 and 1.8).
- City Scale: Variability increases, with ranging from 0.75 to 3.5.
2. The Gamma of Context
When looking at content types (Context-based), the "tail" of the distribution decreases faster. Here, a Gamma Distribution is a better fit.
- This suggests that while individual "hotspots" are extremely dominant, broader categories of interest are more evenly distributed among the population than specific locations.
Temporal Dynamics: Is Demand Volatile?
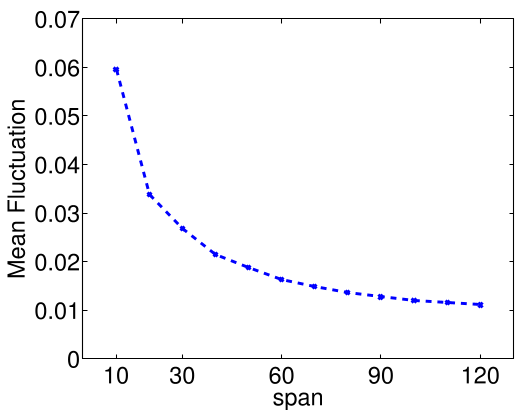
By analyzing Gowalla's timestamps, the author tracked how traffic demand fluctuates.
- Stability: At short time scales (T=15-30 mins), fluctuations are less than 8%. Even at T=5 mins, they stay under 20%.
- Predictability: Most venues show 1 to 3 "peak periods" per day, with popularity dropping to zero only during one contiguous period ().
Critical Analysis & Conclusion
Takeaways:
- For network architects, the type of application determines the math. If you are building a local map sharing app, use Pareto. If you are building a news-by-category offloading service, use Gamma.
- The high stability of short-term traffic demand indicates that opportunistic caching policies do not need to be re-tuned every second; a 15-minute update interval is likely sufficient.
Limitations:
- A check-in is not a download. While correlated, social activity is a "proxy" and may overestimate demand in social hubs while underestimating background data usage.
Future Work: The interplay between these popularity models and mobility models (how users move between these venues) is the next frontier for establishing a complete "Physics" of opportunistic networking.