
Beyond Ad-Hoc Ties: Optimizing the Relevance of Inferred Social Networks
Inferring relevant social networks from interpersonal communication
This paper introduces a systematic framework for Social Network Inference, moving beyond ad-hoc tie definitions in interpersonal communication data. By evaluating two large-scale email datasets (University and Enron), the authors demonstrate that an optimal edge threshold (typically 5–10 reciprocated emails/year) maximizes predictive accuracy for social attributes and behaviors.
TL;DR
Is a single email enough to define a friendship? Probably not. This seminal work argues that we shouldn't just build social networks from communication logs using "gut feelings." Instead, we should define "ties" based on their predictive power. By testing various "intensity thresholds," the authors found that a specific range of communication (5-10 exchanges/year) consistently creates the most useful networks—boosting prediction accuracy for things like job status and gender by up to 30%.
The Problem: The Arbitrariness of "Ties"
In the era of Big Data, we have millions of "events" (emails, tweets, calls) but few "relations." To turn a spreadsheet of emails into a social graph, researchers usually pick a threshold: "If emailed at least times, they are connected."
The issue is that is almost always chosen arbitrarily. Does capture a real social structure, or just "noise" like administrative CCs and one-off inquiries? The authors posit that there isn't one "true" network, but a family of networks, and the "correct" one depends entirely on what you are trying to predict.
Methodology: Tuning the Threshold
The researchers utilized two massive datasets:
- University Logs: 2 years of server logs for ~20,000 users.
- Enron Corpus: The famous public repository of corporate email exchange.
They defined the edge weight as the geometric mean of the annualized rate of messages. By varying a threshold , they could "prune" the network, from dense (all interactions) to sparse (only heavy communicators).
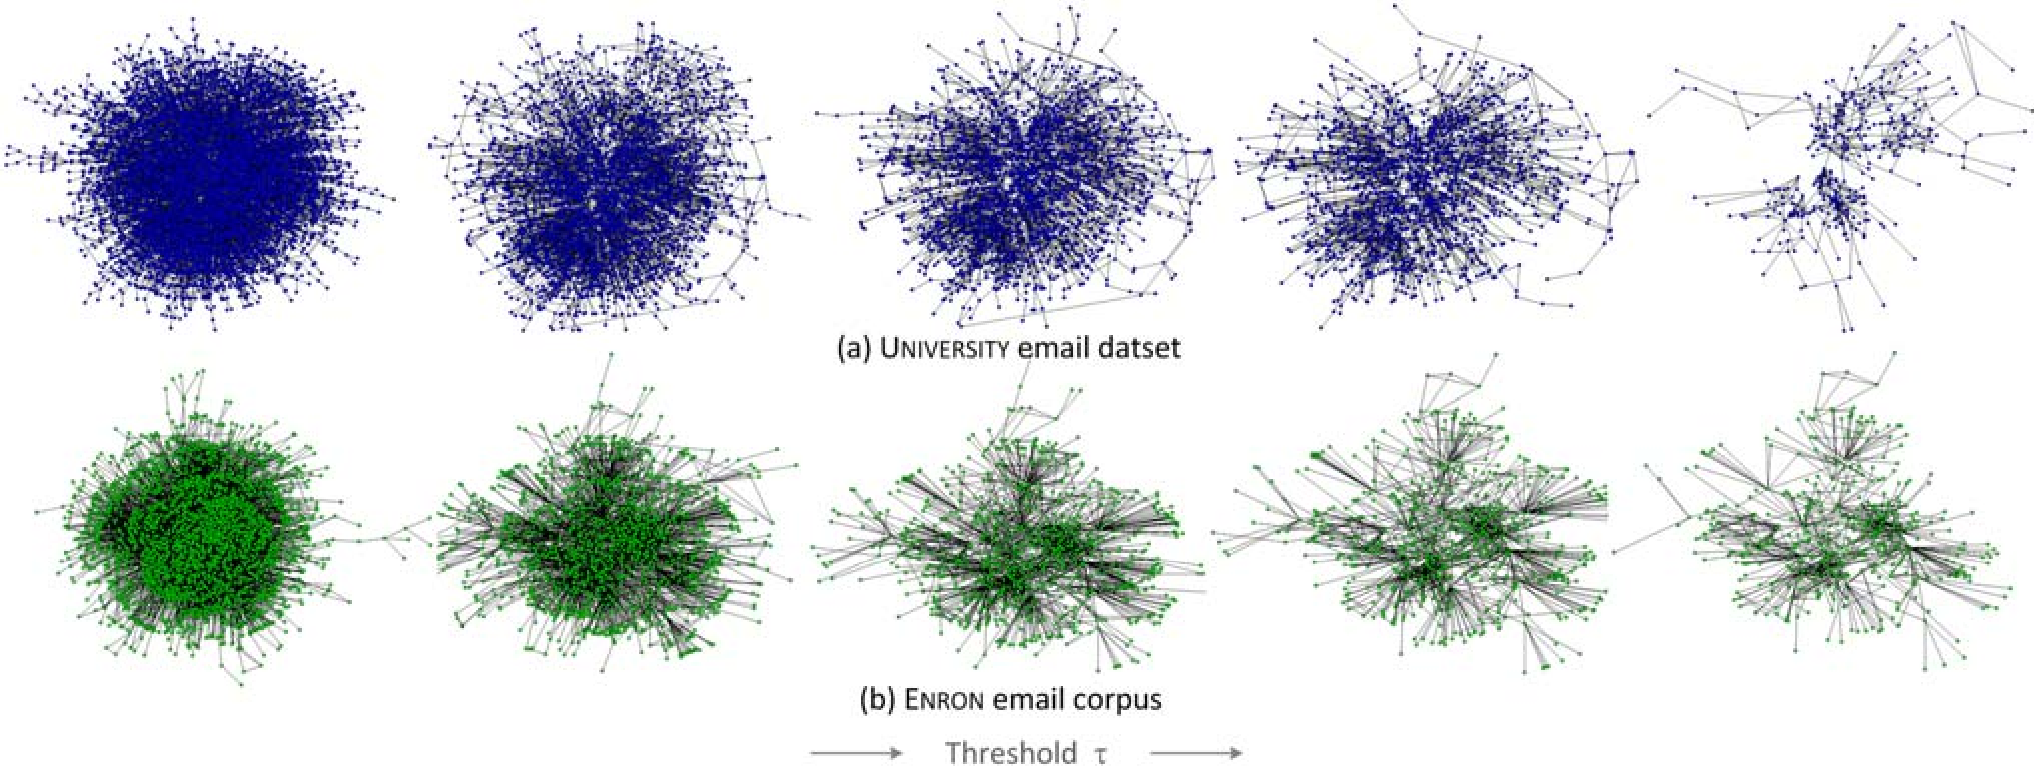 Figure 1: Visualizing how the network topology "shatters" and reforms as the threshold increases from inclusive (left) to exclusive (right).
From Descriptive Stats to Predictive Power
They didn't just look at how the network looked; they tested how well it worked. They used the network structure to predict:
- Node Attributes: Gender and professional status (homophily).
- Dynamics: Future communication frequency.
- Structures: Community membership (Departmental affiliation).
The "Sweet Spot" of Social Signal
The most striking finding was the existence of a "Peak of Relevance." Regardless of whether they were predicting a student's major or a VP's future email count, the best results consistently appeared when was between 5 and 10 reciprocated emails per year.
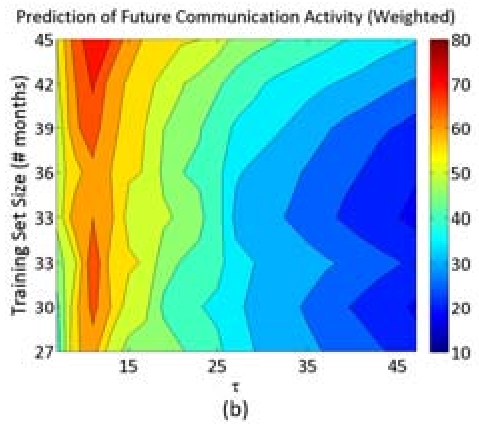 Figure 2: Accuracy peaks. Note how both weighted and unweighted features perform significantly better at non-zero thresholds.
Why does this happen?
- Low thresholds () include "weak bridges" and noise that clouds the local signal.
- High thresholds () prune away the actual social infrastructure, leaving only isolated "cliques" and losing the context of the wider network.
Critical Insight: The Universality of 5-10
The "Enron" world (corporate, 2000s) and the "University" world (academic, late 2000s) are vastly different. Yet, the optimal threshold for signal was nearly identical. This suggests that human interpersonal communication has a "natural frequency" for meaningful social ties that transcends the specific platform or era.
Future Outlook & Limitations
While powerful, this study focuses on frequency as a proxy for strength. It treats communication as a bulk volume, perhaps missing the "multiplex" nature of social life (e.g., I might email you once a year but it's a vital, high-value connection).
The takeaway for modern data scientists is clear: When building a graph, don't just include everything. Treat your network definition as a hyperparameter that must be tuned against a ground-truth task. If you don't, you're likely analyzing 30% more noise than you need to.