
Caught in the Act: Inferring Lockstep Frauds via Spectral Fingerprints
Inferring Strange Behavior from Connectivity Pattern in Social Networks
The paper introduces a novel spectral analysis framework to detect "lockstep behavior" in multimillion-node social networks (specifically Tencent Weibo). It identifies unique geometric patterns in spectral subspaces—"rays" and "pearls"—to uncover suspicious groups of followers who act in coordination to artificially inflate the popularity of followees.
TL;DR
How do you spot a "link farm" in a sea of 3.33 billion edges? This paper reveals that coordinated social media fraud—where bot armies follow specific targets in "lockstep"—leaves unmistakable geometric signatures in the graph's spectral subspace. By looking for "Rays" and "Pearls" in projected dimensions, the authors developed a scalable algorithm to unmask millions of fake interactions on Tencent Weibo.
The "Lockstep" Challenge: Why Density Isn't Enough
In the world of social media, "influence" is currency. This creates a market for "lockstep behavior," where a group of followers is paid to follow a group of followees .
While this sounds like a simple "dense block" in an adjacency matrix, real-world fraudsters use two clever tactics to hide:
- Camouflage: Bots follow famous, legitimate accounts to look like normal users.
- Partial Overlap: Different bot groups share some members or targets, creating a "staircase" of connectivity that blurs the lines of a traditional cluster.
The Core Insight: Geometry in Spectral Subspaces
The authors utilize Singular Value Decomposition (SVD) to project the massive adjacency matrix into a lower-dimensional spectral subspace. Instead of just looking at raw links, they look at the coordinates of users on the singular vectors. Their breakthrough was defining how specific behaviors transform into specific shapes:
1. The "Ray" Pattern
When a group of followers connects to a target group, they align along a straight line passing through the origin in the spectral plot.
- Rule 1 & 2: Higher density creates shorter, denser rays; lower density elongates them.
- Rule 3 (The Tilted Ray): When bots use "camouflage" (random extra follows), the ray tilts away from the axis.
2. The "Pearl" Pattern
When lockstep groups partially overlap (a "staircase" in the matrix), they don't form lines. Instead, they form spherical micro-clusters that sit at a distance from the origin—looking like a string of pearls.
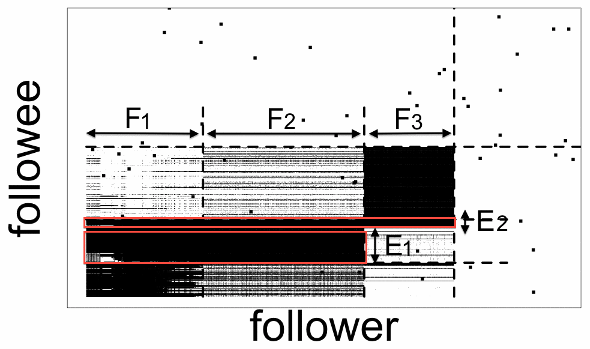 Figure 1: Comparison between "Block" connectivity creating "Rays" (c, d) and "Staircase" connectivity creating "Pearls" (e, f).
Process: From Visualization to Automation
The paper doesn't just rely on "looking" at plots. They propose a robust pipeline:
- SVD Projection: Reduce the graph to its top singular vectors.
- Hough Transform: Borrow a technique from computer vision to automatically detect the lines ("rays") and clusters ("pearls") in the spectral plots.
- Lockstep Propagation: Using the detected nodes as "seeds," the algorithm recursively scores their neighbors. If you follow many known bots, your "lockstep score" increases; if a bot follows many "lockstep followees," its score increases.
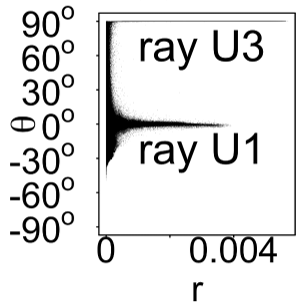 Figure 2: The automated detection workflow using spectral plots and frequency spikes.
Experimental Proof: Cleaning Tencent Weibo
The researchers applied this to the Tencent Weibo dataset (117M nodes). The results were striking:
- Bot Profiles: The accounts caught by the "Ray" and "Pearl" patterns had suspicious naming conventions (e.g., "a27217") and identical birthdays (Jan 1st), confirming they were script-generated.
- Graph Cleanup: Real social networks usually follow a "Power Law" distribution. The original Weibo data had weird "spikes" in its degree distribution. Once the identified lockstep users were removed, the graph returned to a natural, smooth distribution.
 Figure 3: Power-law distribution before and after the removal of detected lockstep groups.
Conclusion & Limitations
This work demonstrates that the "physical" properties of graph spectra are incredibly resilient to the camouflage techniques used by fraudsters. While powerful, the method relies on SVD, which can be computationally expensive for dynamic graphs. However, as a tool for "chipping" away large-scale coordinated attacks, the geometric mapping of social behavior remains a landmark approach in network science.