
Beyond Co-occurrence: Inferring Competitive Dominance via Win-Lose Product Networks
Inferring win-lose product network from user behavior
This paper introduces the "Win-Lose Product Network," a novel data mining approach to infer superiority relations between substitutable products by analyzing the discrepancy between user browsing and purchasing behaviors. By aggregating these directed relations and mining associated product reviews, the authors develop a system to visualize market competition and extract specific "superiority factors" that drive consumer choices.
TL;DR
Researchers from the University of Tokyo have developed a method to transform standard e-commerce logs into a "Win-Lose Network." By analyzing the gap between what users look at versus what they actually buy, the system identifies which products are outperforming their direct rivals and uses review mining to pinpoint exactly why (e.g., better hospitality, specific design features). This approach matches actual human survey data with high precision while being entirely automated.
Background: The Blind Spot in Product Networks
In the world of e-commerce data mining, we are very good at knowing that people who buy bread also buy butter (Complementary) or that people look at five different cameras before picking one (Substitute). However, we have been historically bad at understanding the directional hierarchy of attractiveness.
If a user looks at Nikon, Canon, and Sony but chooses Sony, Nikon and Canon didn't just "co-occur"—they lost. Understanding this "Win-Lose" dynamic is the difference between simply knowing who your competitors are and knowing why they are beating you.
Methodology: Turning Logs into a Battlefield
The paper's core innovation lies in its formalization of user behavior into three distinct categories:
- Not Browsed: Irrelevant for this specific transaction.
- Browsed but Not Purchased (Loser): Explicitly declined after consideration.
- Purchased (Winner): The superior choice for that user's specific constraints.
1. The Win-Lose Network
By connecting Losers to Winners across thousands of sessions, the authors create a directed graph . Unlike traditional undirected networks, the weight and direction of these edges reveal the "gravity" of product attractiveness.
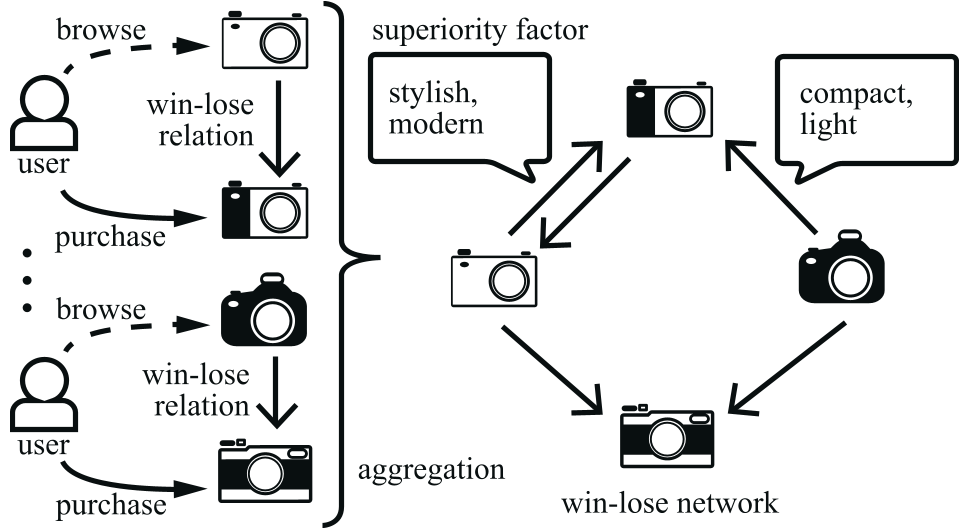 Figure 1: Conceptual overview of how browsing/purchasing paths define the Win-Lose relation.
2. Superiority Factor Analysis
Knowing that you lost is only half the battle. To find out why, the authors look at the reviews written by the "Winner" group. By applying tf-idf specifically to the text of users who moved from Product B (Loser) to Product A (Winner), the algorithm extracts "Factor Words"—the specific vocabulary of victory.
Experimental Results: Real-World Validation
The authors tested this on Zexy, Japan's largest wedding portal. Wedding venues are high-stakes, high-consideration "products," making the browsing-to-purchase path extremely data-rich.
- Network Visualization: The resulting competitive map (Figure 4) perfectly segmented the Japanese market by region, proving that competition is primarily local and geography-driven.
- Survey Correlation: The researchers compared their algorithmic findings against a manual survey of 173 couples. The correlation was statistically significant (), suggesting that behavioral logs are a valid substitute for expensive manual surveys.
- Precision Gains: In identifying superiority factors, the proposed method improved accuracy by 17% over a baseline that just looked at a product's reviews in isolation.
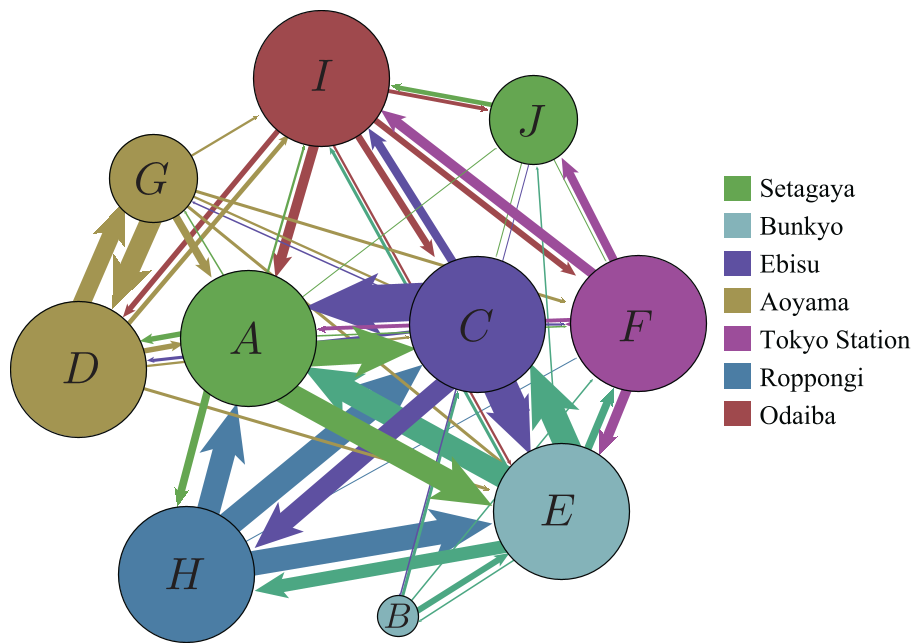 Figure 2: The Win-Lose network of venues in Tokyo. Arrows show the flow of "preference" from one venue to another.
Deep Insights: The "Against" Factor
One of the most compelling findings was how a single product's "selling point" changes depending on whom it is being compared to.
- Venue H vs. Venue A: The winning factors were "garden" and "banquet."
- Venue H vs. Venue J: The winning factors shifted to "Japanese-style room" and "transportation."
This suggests that "attractiveness" is not a static attribute of a product, but a relational one. Marketing strategies should therefore be dynamic: "Talk about the garden when fighting Competitor A, but talk about the bus service when fighting Competitor J."
Critical Analysis & Conclusion
Takeaway
For product managers, this methodology provides an automated "War Room" view. It transforms passive logs into active intelligence, identifying which features are "deal-breakers" in specific competitive head-to-heads.
Limitations
The model currently assumes a "Law of One Price" environment and works best where products are clear substitutes. In massive marketplaces like Amazon, significant noise is introduced by complementary products (e.g., buying a laptop and a bag) and price fluctuations, which might require pre-filtering or category-specific sub-graphs.
Future Work
The next frontier for this research involves Sentiment Polarity. Currently, the method identifies what features were important (Factor Words), but not necessarily if they were viewed positively or negatively (though the "Winner" status usually implies positivity). Integrating Aspect-Based Sentiment Analysis (ABSA) could further refine the "Why" behind the win.