
Beyond the Filter Bubble: A Graph-Based Framework for Measuring Behavioral Diversity
Information Processing and Management
2010-01-01
Summary
Problem
Method
Results
Takeaways
Abstract
This paper introduces a formal framework for measuring user behavior diversity on online platforms, specifically within musical content. By representing user activity as a tripartite graph (Users-Products-Categories), the authors propose the Calibrated Herfindahl Diversity index, derived from random walks, to quantify the distribution of attention across categories.
## TL;DR
Researchers from Sorbonne Université and CNRS have developed a new mathematical lens to view digital diversity. By mapping Users, Songs, and Genres into a **tripartite graph**, they’ve created the **Calibrated Herfindahl Diversity** index. Their findings suggest that our "narrow" tastes might not be entirely our fault—they are largely a byproduct of the unequal popularity of music styles globally.
## The Motivation: Why Current Diversity Metrics Fail
How do we know if a recommendation engine is making our world smaller? Most existing research looks at the *distance* between items (e.g., "Are these two songs similar?"). However, this ignores the **structure** of our interaction.
The authors argue that diversity isn't just about what you touch, but the *paths* you take through categories. Furthermore, they identify a massive bias in current research: **Volume**. People who listen to more music naturally seem more "diverse" simply because they have more data points. To truly understand behavior, we need a way to measure diversity that is independent of how active a user is.
## Methodology: The Tripartite Random Walk
The core innovation lies in the representation of data. Instead of a simple list, user activity is modeled as a graph with three layers:
1. **Bottom Layer ($\perp$):** Users.
2. **Middle Layer ($\vdash$):** Products (Songs).
3. **Top Layer ($ op$):** Categories (Tags/Genres).
### The Calibrated Herfindahl Index
By performing a **Random Walk** from a user to a category via songs, the authors calculate the probability distribution of that user's attention. They use the Herfindahl-Hirschman Index (a tool from economics used to detect monopolies) to score this distribution.
To solve the "Volume Bias," they use a **Null Model** (Configuration Model). They compare the real diversity score against a "randomized" version of the same user. If the real score is significantly lower than the random one, it indicates a genuine lack of diversity.
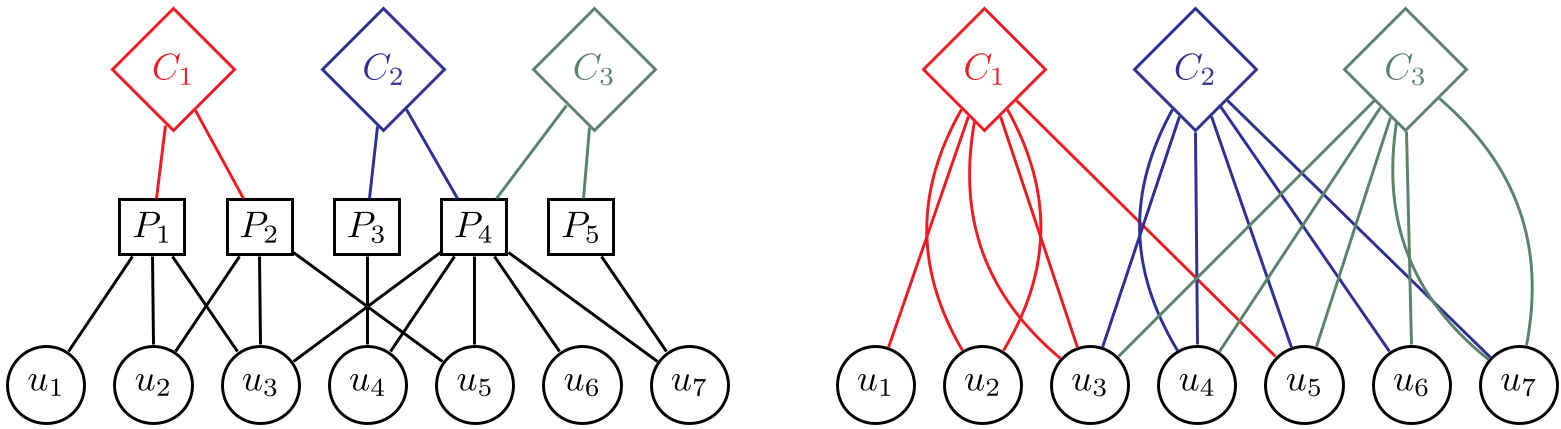
*Figure 1: The tripartite graph structure (left) connects users to categories through products, allowing for a nuanced flow of 'attention'.*
## Key Insights from the Data
### 1. The Saturation Phenomenon
The study analyzed the *Million Song Dataset* and *Amazon Reviews*. A striking pattern emerged: **Saturation**. As users consume more content, their diversity grows rapidly at first but then hits a plateau. In the MSD dataset, after roughly 500 "listen events," an average user starts repeating similar styles, and their diversity score stagnates.
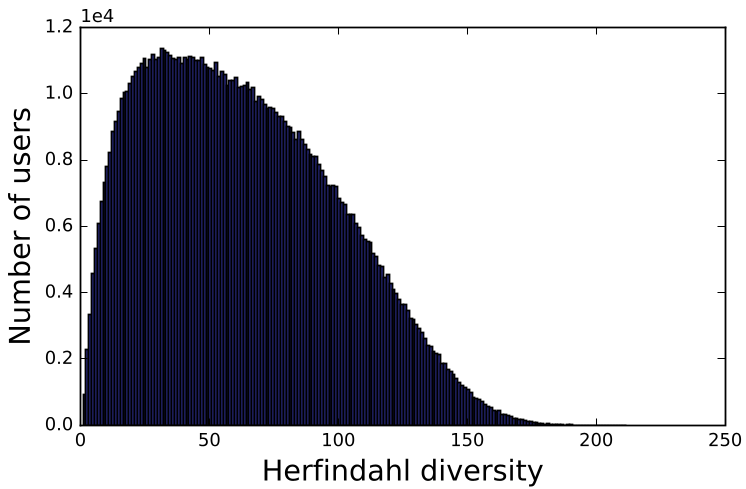
*Figure 2: The relationship between activity volume and diversity shows a clear 'inflection point' where incremental activity no longer broadens the user's horizon.*
### 2. Style vs. Generic Tags
The calibrated index effectively distinguished between "Style" tags (like *Metal* or *Country*) which have a narrow, dedicated audience, and "Generic" tags (like *Favorites* or *Chill*) which act as bridges between many different types of users.
### 3. Nature vs. Nurture (The Random Model Test)
The most profound finding comes from comparing different random models. The authors found that a **Tag-Related Model** (which only considers the global popularity of music styles) could almost perfectly replicate the diversity limits found in real users.
* **Implication:** The "filter bubble" we observe might be less about our individual stubbornness and more about the "exogenous pressure" of what is popular on the platform.
## Critical Analysis & Conclusion
This paper shifts the responsibility of diversity from the user to the platform. By proving that structural popularity limits our horizons, it provides a mathematical justification for **Algorithmic Intervention**.
### Limitations
While the framework is robust, it relies on the quality of "Tags." In the Amazon dataset, tags are hierarchical and rigid; in Last.fm, they are "folksonomies" (user-generated) and messy. The index's accuracy is only as good as the category layer metadata.
### Future Work
The next step for this research is to apply this index to **Recommendation Algorithms** directly. Can we use the "Calibrated Herfindahl Diversity" as a loss function to force an AI to recommend items that truly broaden a user's world?
**Takeaway:** Diversity is not just a "nice-to-have" metric; it is a structural property of how information is distributed. To fix the lack of diversity in our digital lives, we must address the underlying "popularity bias" of the systems themselves.