
MentionStats: Enhancing Organizational Reputation via Interactive Sentiment Visualization
Using Information Visualization Techniques to Improve the Perception of the Organizations’ Image on Social Networks
The paper introduces MentionStats, an iOS-based visualization prototype designed to monitor and analyze organizational reputation on Twitter. It leverages sentiment analysis and interactive data visualization (e.g., temporal heatmaps, granular timelines) to help professionals perceive public image in real-time.
TL;DR
As social networks like Twitter become the primary battleground for brand reputation, organizations need more than just a list of tweets—they need visual intelligence. This paper presents MentionStats, a prototype that transforms Twitter mentions into interactive sentiment dashboards. By using color-coded categorization and temporal "zoomable" visualizations, it allows professionals to diagnose their brand's "emotional health" at both a macro (daily) and micro (hourly) level.
The Perception Gap: Beyond Raw Data
In the era of Web 2.0, an organization's image is no longer dictated solely by their PR department, but by the "wisdom (or wrath) of the crowd." The authors identify a significant pain point: while data mining techniques for social media exist, they often lack the visual intuition required for non-technical managers to make split-second decisions. The motivation behind this work is to bridge the gap between complex sentiment algorithms and human-centric decision support.
Methodology: The MentionStats Framework
The core of MentionStats lies in its ability to translate subjective text into objective visual markers. The system uses a customizable dictionary-based sentiment engine to classify mentions.
Architectural Highlights & Interaction Patterns
- Sentiment Mapping: Tweets are automatically flagged as Good (Green), Neutral (Yellow), or Bad (Red).
- Temporal Fluidity: Users can use "pinch-in" and "pinch-out" gestures to navigate time. You can view 30 days of data and drill down into a specific hour to see exactly when a PR crisis started or a marketing campaign gained traction.
- Customizable Lexicon: Recognizing that different industries have different "slang," the tool allows users to manually adjust the sentiment dictionary.
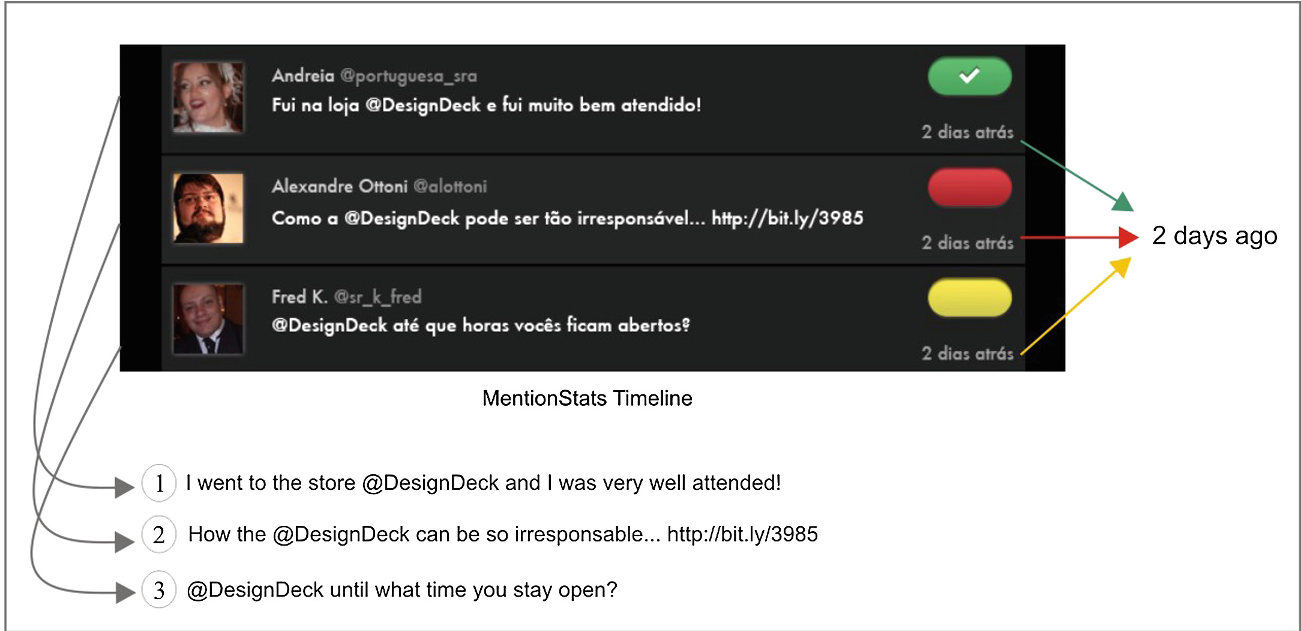 Figure 1: The Timeline view showing color-coded badges for immediate sentiment recognition.
Data-Driven Insights
The researchers conducted qualitative interviews with marketing and social media professionals. The feedback was overwhelmingly positive regarding the Statistics Panel, which provides a dual-view approach: one static (percentages) and one interactive (temporal circles).
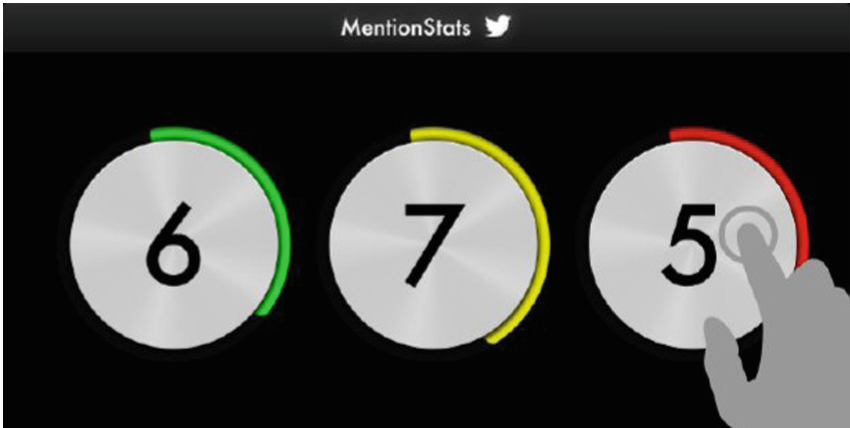 Figure 2: The Statistics section provides a clear percentage-based overview of the organization's perceived image.
Key Findings:
- Speed of Analysis: Professionals noted that the visual grouping of "Good vs. Bad" allows for faster feedback loops—rewarding employees for positive mentions and mitigating damage for negative ones.
- Decision Support: The ability to see sentiment "spikes" localized to specific hours helps in correlating brand perception shifts with real-world events or company tweets.
Critical Analysis & Professional Takeaway
While MentionStats represents a significant step forward in Social Media Analytics (SMA), it does have limitations typical of early-stage prototypes. The reliance on a dictionary-based approach is susceptible to sarcasm and linguistic nuances (e.g., verb tenses). However, the paper's focus on Interaction Techniques—specifically the use of touch-based temporal zooming—is a high-value contribution for mobile-first business intelligence.
Future Outlook
The authors suggest that future iterations will incorporate more robust NLP (Natural Language Processing) and potentially expand to cross-platform monitoring. For the modern enterprise, this work underscores a vital truth: Data is only as useful as its visual clarity.
Takeaway for the Industry: Tools that prioritize the "human visual system's ability to recognize patterns" outperform raw data feeds in high-pressure decision-making environments.