
Decoding Crime Networks: A Social Network Analysis of NYC Burglaries
15298_Integrating near repeat and social network approaches to analyze crime patterns.
This study applies Social Network Analysis (SNA) to model the "near-repeat" phenomenon in urban burglary, specifically across New York City's five boroughs. By constructing spatial networks where nodes represent crime incidents and edges connect crimes within a 200-meter proximity, the authors quantify topological patterns of criminal activity using metrics like clustering coefficients and betweenness centrality.
TL;DR
Crime is rarely a series of isolated incidents. This study re-imagines New York City burglary data as a complex social network. By defining "connections" based on spatial proximity (the Near-Repeat phenomenon), the researchers identify how crime clusters and which urban areas act as critical hubs or bridges for criminal activity.
Background: The "Near-Repeat" Intuition
Criminologists have long observed that if a house is burgled, the risk to nearby properties increases significantly for a short period. This is known as the Near-Repeat effect. While traditional maps show where crime happens, they don't show the structure of these risks. This paper shifts the focus from points on a map to nodes in a network.
Methodology: Building the Spatial Graph
The authors define a network where:
- Nodes (): Individual burglary incidents recorded by the NYPD.
- Edges (): A link is created between two crimes if the distance () between them is 200 meters or less.
Key Metrics Applied:
- Clustering Coefficient (): Measures how "tight-knit" a local group of crimes is. If a crime's neighbors are also neighbors of each other, the area is a dense crime cluster.
- Betweenness Centrality (): Identifies incidents that act as "bridges" between different clusters. High betweenness suggests a location that connects disparate crime zones.
- Degree Distribution: Indicates how many other crimes are linked to a single event, highlighting "super-spreader" locations for criminal activity.
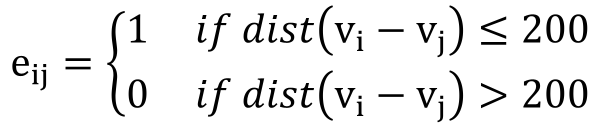 The mathematical definition of edges based on the 200m spatial threshold.
Regional Analysis: Manhattan vs. The Outer Boroughs
The study reveals striking differences in how crime "networks" across NYC:
| Statistics | Manhattan | Brooklyn | Queens |
|---|---|---|---|
| Max Degree | 103 | 24 | 11 |
| Avg. Clustering | 0.688 | 0.626 | 0.463 |
| Total Edges | 24,180 | 21,926 | 7,382 |
Insights from the Data:
- Manhattan’s Hyper-Connectivity: With a maximum degree of 103, Manhattan contains massive "hubs" where a single area is tied to over a hundred related incidents. This suggests a high density of opportunistic crime in a compact geographic space.
- Fragmentation in Queens: Despite having a similar number of nodes to Manhattan, Queens has significantly fewer edges and lower clustering. This implies that burglaries in Queens are more isolated or occur in smaller, less connected clusters.
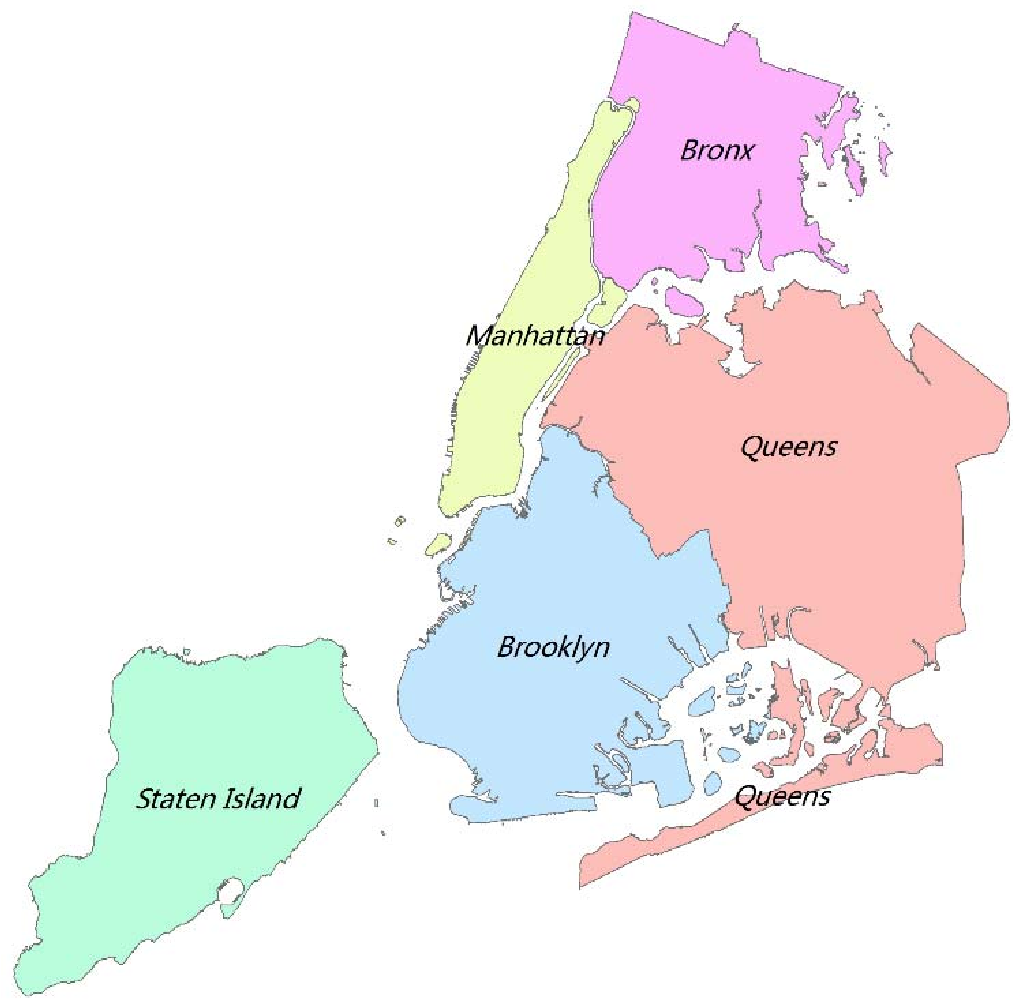 Visualization of the study areas and incident distributions across the five boroughs.
Why This Matters for Public Safety
By treating crime as a network, police departments can move beyond "patrolling hotspots."
- Targeting Bridges: Using Betweenness Centrality, authorities can identify the specific streets or blocks that link different crime clusters. Disrupting the "link" might prevent the spread of a local crime wave.
- Understanding Urban Fabric: The high clustering in Manhattan versus the low clustering in Staten Island suggests that urban design and density directly influence the "topology" of crime.
Critical Analysis & Future Work
While the spatial network provides a powerful structural view, the current methodology relies on a static 200m buffer. The study would benefit from:
- Temporal Weighting: Near-repeat effects decay over time. Future models should weight edges by how close in time the crimes occurred.
- Directionality: Understanding the sequence of crimes could help model the "path" a serial offender takes through the network.
Conclusion
This research successfully demonstrates that urban burglary is non-random and highly structured. By leveraging Social Network Analysis, we can quantify the "connectivity" of crime, providing a more nuanced tool for urban planning and predictive policing.
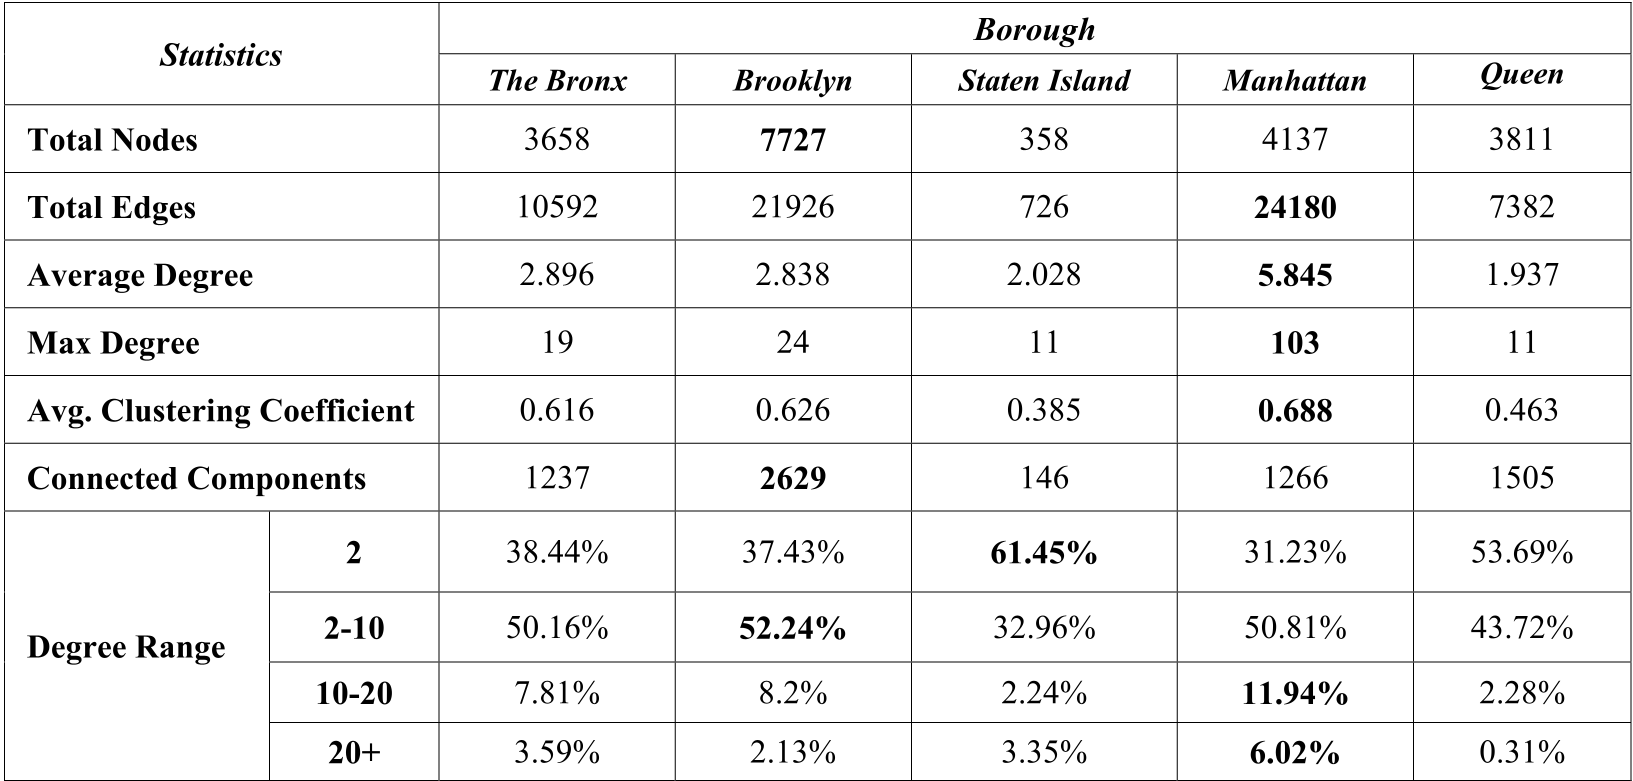 Comprehensive breakdown of graph metrics per borough.