
IntelliView: Solving Social Network Overload via Intelligent Geo-Mapping
An Approach to Intelligent Interactive Social Network Geo Mapping
This paper introduces IntelliView, an intelligent map-based visualization framework for social networks. It utilizes a hybrid ranking algorithm combining content-based filtering and collaborative filtering to present personalized, geotagged objects on an interactive map interface, effectively mitigating information overload in dynamic data environments.
TL;DR
As social media data becomes increasingly geotagged, the challenge shifts from "finding data" to "visualizing it without chaos." This paper presents IntelliView, a system that ranks social objects using a blend of personal interest and collaborative intelligence. By applying these ranks to a map interface, it ensures that even in dense data areas, the most relevant "events" or "items" surface through smart layering and opacity adjustments.
Background & Motivation: The Scaling Problem
Standard social network visualizations are typically built for analysts (think complex node-link diagrams) rather than everyday users. When these networks are mapped geographically, we face a "collision" problem: if 1,000 items exist in one city block, a standard map becomes unreadable.
The authors argue that location is only the first filter. To provide a truly useful interface, the system must understand user intent to determine which 5 items out of those 1,000 deserve to be seen.
Methodology: The Science of Significance
The core of the paper is a three-tiered scoring mechanism that determines an object's "visibility" on the map.
1. The Global Ranking Formula
The importance of an object () is calculated as:
- (General): Based on explicit feedback, object age (decay), and expert-assigned category weights.
- (Personal): Computed on-the-fly based on the user's top keywords and preferred categories.
- (Collaborative): Pre-computed daily using graph-based algorithms to find what "similar users" are interacting with.
2. Intelligent Distribution Function
To prevent scores from clustering, the authors use a distribution function based on the curve. This stretches the differences around the median, ensuring that "average" items are clearly distinguished from "high-relevance" items.
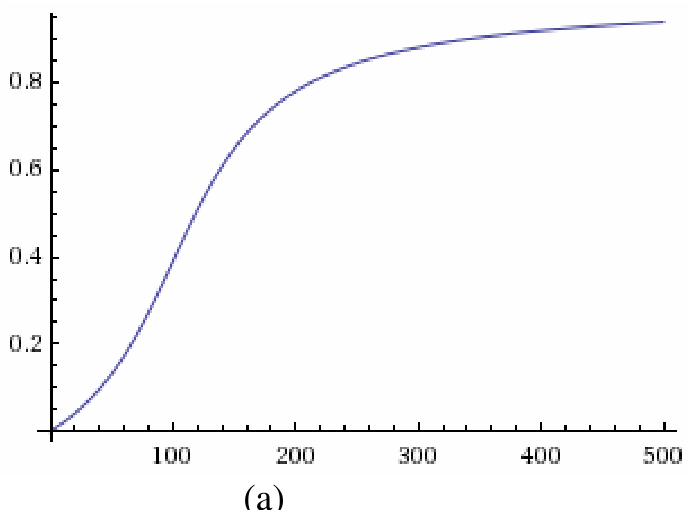 Figure 1: Comparison of different 'a' values in the distribution function to sharpen the distinction between relevancy levels.
3. Visual Layering (Collision Management)
Unlike a static map, IntelliView uses a priority-queue approach for rendering:
- High Priority: Large, opaque icons.
- Medium Priority: Reduced size and increased transparency.
- Hidden: Objects that collide with higher-priority items are hidden, but their presence is indicated by the background color of the topmost item (representing local density).
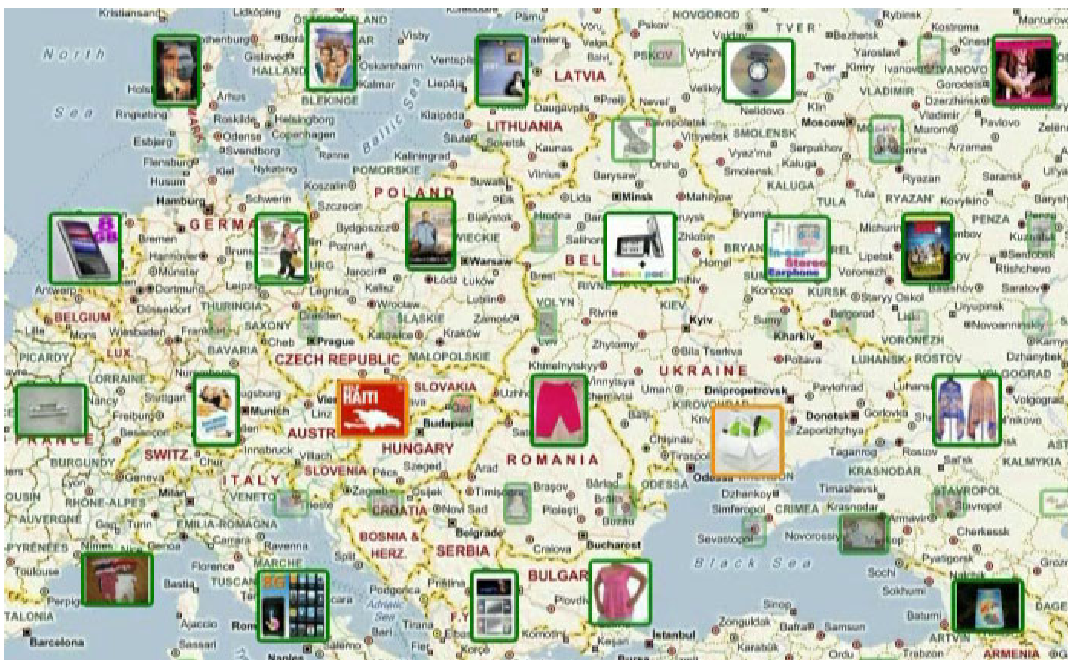 Figure 2: The UI in action. Note how the "Donation for Haiti" emerges as a high-priority cluster in Slovakia due to high local and social relevance.
Real-time Dynamics: RealView
A map shouldn't just be a snapshot. The authors introduced RealView, which "stacks" animations of social actions (like a new post or a donation). By implementing a time-sensitive filtering system, the map stays "alive" with animations of the most relevant actions without overwhelming the user's peripheral vision.
Evaluation & Results
The researchers built Present, a resource-recycling social network, to test this.
- Scalability: By using genetic algorithms to generate 2.7 million virtual users, they proved the system could handle massive datasets on modest hardware by offloading collaborative filtering to pre-computation stages.
- User Acceptance: A study showed that users felt much more "comfortable" (60%) with this prioritized layout compared to standard dense map views.
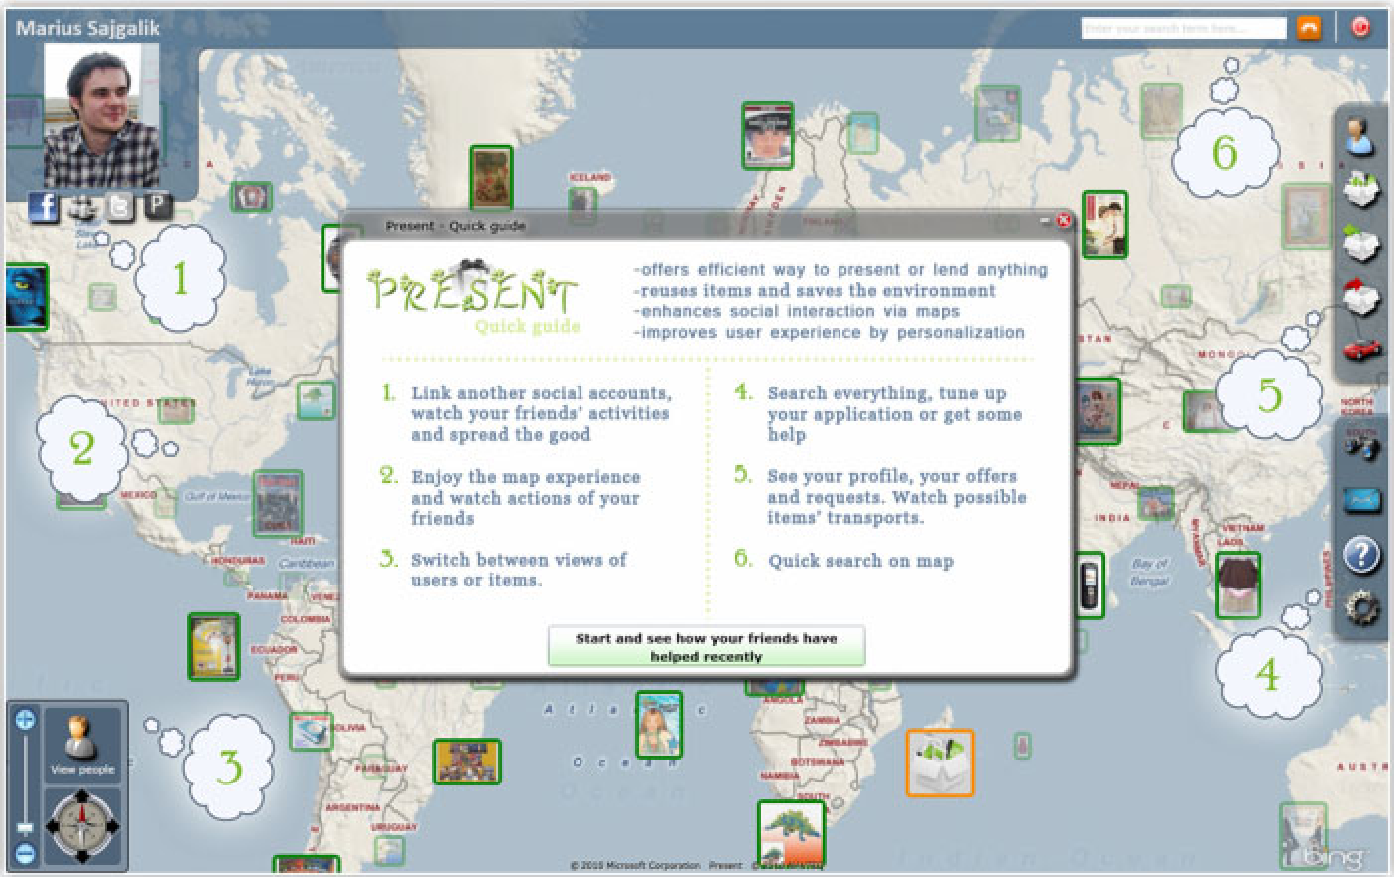 Figure 3: Overview of the Present system, integrating social feeds with the intelligent geo-map.
Critical Insight: Why This Matters
The brilliance of IntelliView lies in its Inductive Bias—the assumption that geographic proximity is a primary human mental model for organization, but personal relevance is the primary filter for attention.
Limitations: The reliance on manually tuned coefficients () is a potential bottleneck. In modern contexts, these would likely be replaced by a Reinforcement Learning (RL) agent that adjusts weights based on click-through rates (CTR).
Conclusion
IntelliView successfully bridges the gap between massive social graphs and intuitive map interfaces. By treating "visibility" as a scarce resource allocated by a hybrid ranking engine, it provides a blueprint for the next generation of location-aware social applications that prioritize user attention over raw data volume.