
GA2M: Solving the Accuracy-Intelligibility Paradox in Healthcare AI
Intelligible Models for HealthCare: Predicting Pneumonia Risk and Hospital 30-day Readmission
The paper presents GA2M (Generalized Additive Models with pairwise interactions), a machine learning framework that achieves state-of-the-art accuracy while maintaining high intelligibility. Applied to healthcare tasks like Pneumonia risk and 30-day hospital readmission, it matches the performance of "black-box" models like Random Forests and Boosted Trees (AUC 0.857 and 0.783 respectively) while remaining human-interpretable and editable.
TL;DR
This classic paper from KDD 2015 introduces GA2M (Generalized Additive Models with Pairwise Interactions), a method that finally bridges the gap between the transparency of Logistic Regression and the predictive power of Boosted Trees. By visualizing risk as a sum of individual feature "shapes," the authors demonstrate how to detect and fix dangerous biases in medical data—like the infamous "Asthma Paradox"—without sacrificing SOTA performance.
Background Positioning
In the machine learning hierarchy, this work serves as a foundational pillar for Explainable AI (XAI). It moves beyond "post-hoc" explanations (like SHAP or LIME) by creating a model that is intrinsically interpretable. It is the academic precursor to what is now widely known in industry as the Explainable Boosting Machine (EBM).
The Problem: The Danger of "Black Box" Success
The central motivation of this research is a chilling realization from a 1990s study: a high-accuracy Neural Network predicted that patients with asthma had a lower risk of dying from pneumonia.
The Insight: This wasn't a bug in the math, but a reflection of a "hidden" reality in the data. Asthmatic patients were admitted directly to the ICU, and the aggressive care they received made them more likely to survive. A black-box model, seeing only "Asthma = Low Death Rate," would suggest sending asthmatics home—a potentially fatal clinical error.
Methodology: The Architecture of GA2M
The authors suggest that we don't need deep, tangled trees to get high accuracy. Instead, they use a Generalized Additive Model (GAM) structure:
- Univariate Terms (): Each feature gets its own shape function (learned via bagged gradient-boosted trees).
- Pairwise Interactions (): The model specifically looks for interactions between two variables (e.g., Age vs. Cancer).
- Modularity: Because the terms are added together, an expert can look at a specific graph, identify a "wrong" pattern (like the asthma dip), and manually flatten it or remove it without retraining the entire model.
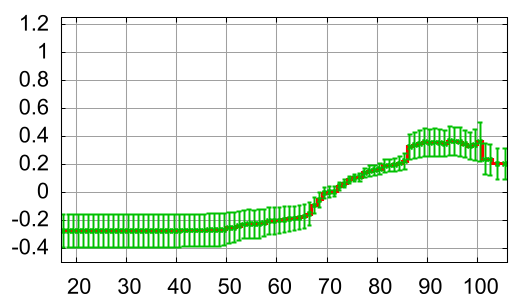 Figure 1: Visualization of multiple shape functions in the Pneumonia model. Note how each graph represents the 'risk' (log odds) added by a specific clinical feature.
Experiments & Results: Accuracy vs. Insight
The paper confirms that GA2M isn't just a "toy" for small data. On a massive 30-day readmission dataset (200k patients, 4,000 features), it outperformed standard Logistic Regression by over 3% in AUC—a massive gap in clinical settings.
| Model | Pneumonia AUC | Readmission AUC |
|---|---|---|
| Logistic Regression | 0.8432 | 0.7523 |
| GA2M (Intelligible) | 0.8576 | 0.7833 |
| LogitBoost (Black Box) | 0.8493 | 0.7835 |
Individual Patient "Explanations"
One of the most powerful aspects illustrated is the "Individual Case" view. For any single patient, the model can list exactly which 5 or 10 factors drove their risk score.
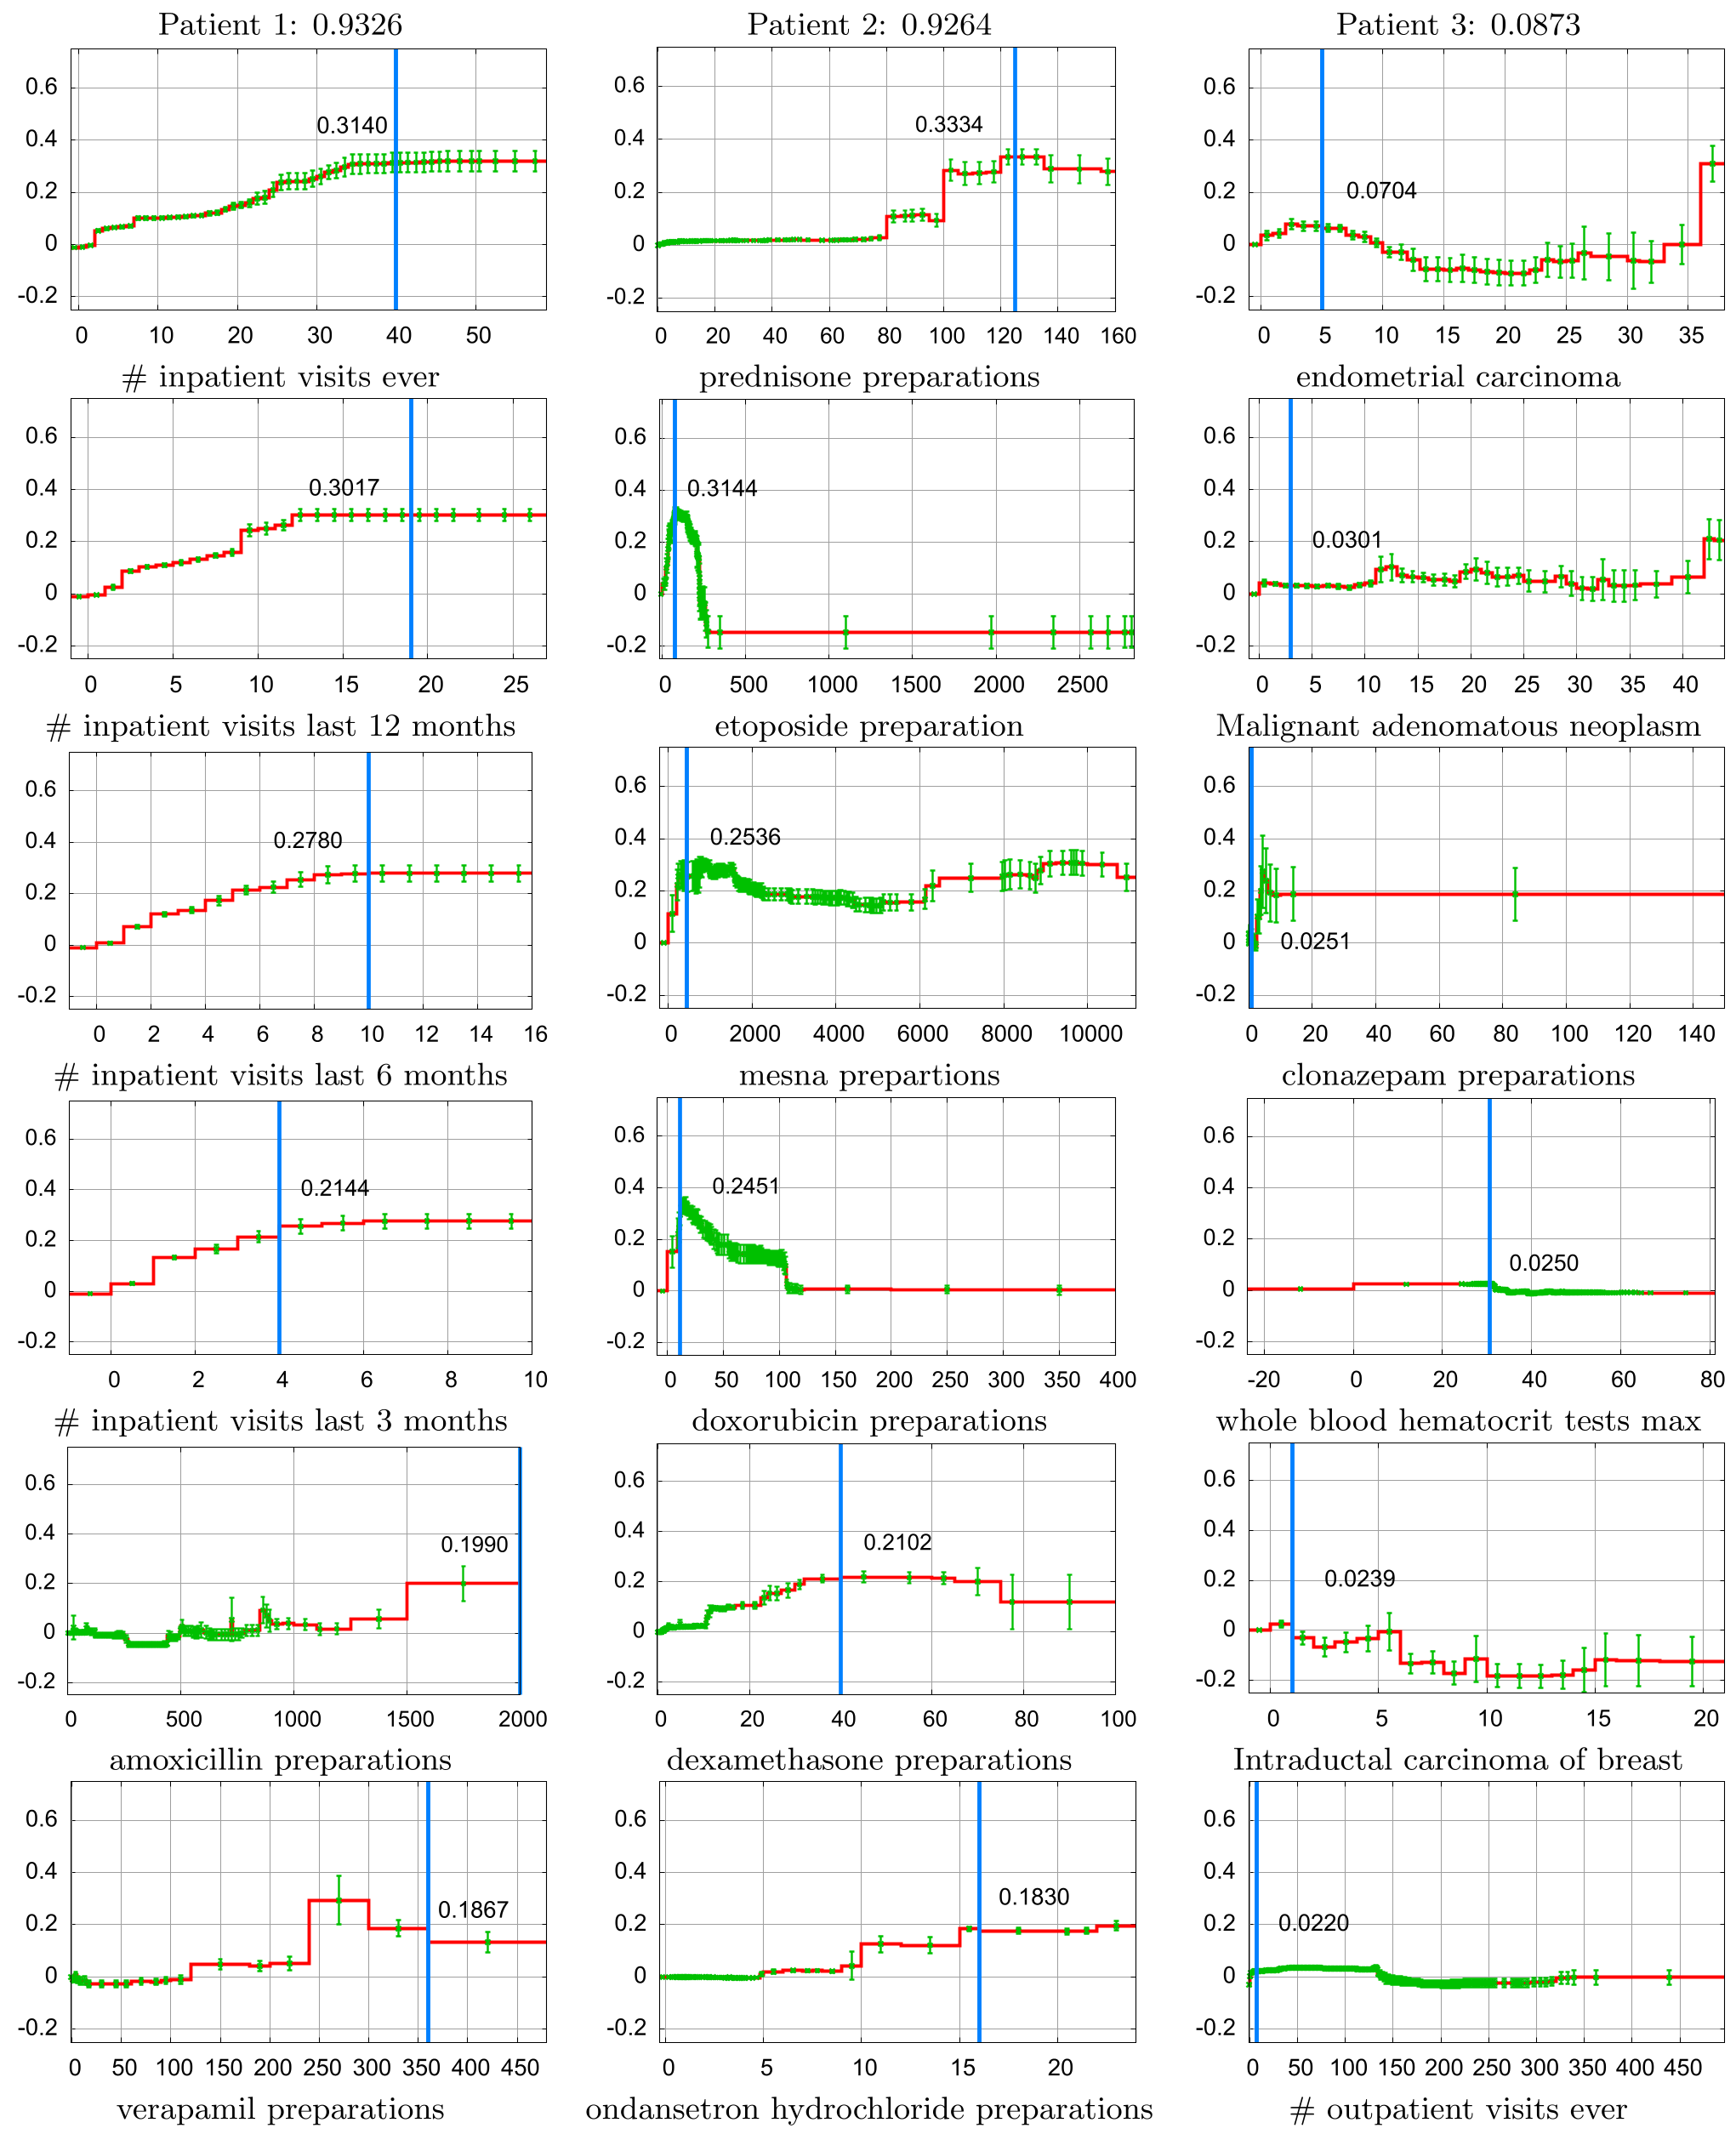 Figure 2: Breaking down the risk for three different patients. This allows a doctor to see, for instance, that Patient #2's high risk is driven primarily by their chemotherapy medications.
Deep Insight: Why Continuous Shaping Matters
Standard medical risk scores (like CURB-65) usually discretize data into buckets (e.g., Age 18-40, 40-65). GA2M reveals more nuance.
In the pneumonia data, the Age graph shows a sharp, unexplained "step" in risk at age 67 and age 86. These non-linear jumps suggest systemic changes (perhaps related to retirement or changes in insurance coverage) that a simple linear model or a human-binned model would completely miss.
Critical Analysis & Conclusion
Takeaway
GA2M proves that intelligibility is a form of safety. By making the model's internal logic visible as simple graphs, we can audit the "machine's thinking" and ensure it isn't making decisions based on harmful medical artifacts or data leakage.
Limitations
- Discovery vs. Causation: As the authors note, these graphs show correlation, not necessarily causation.
- Interaction Limits: While pairwise interactions () are easy to visualize as heatmaps, higher-order interactions () would destroy intelligibility.
- Scalability: Training thousands of interactions on massive datasets requires significant compute (2-3 days in the 2015 study, though much faster today).
Future Outlook
This work paved the way for modern libraries like InterpretML. In the era of LLMs and deep learning, the GA2M approach remains the "gold standard" for tabular data in regulated industries where "the computer said so" is not an acceptable answer.