
Digital Connection in Southern Brazil: Mapping Social Media Intensity and Interaction
Intensity Use of Social Networks in Southern Brazil
This study investigates the intensity and frequency of social network usage in Southern Brazil using a quantitative survey of 372 respondents. It identifies Facebook and WhatsApp as the dominant platforms, primarily accessed from home, and examines the correlation between specific network types and daily time expenditure.
TL;DR
This paper provides a quantitative snapshot of digital habits in Southern Brazil, revealing that Facebook and WhatsApp dominate the social landscape. By analyzing 372 respondents, the study finds that visual and interactive platforms command the most "time-share," with a significant portion of the population spending over two hours daily connected, predominantly from their homes.
Problem & Motivation: Beyond the Platform
The transition from Web 1.0 to Web 2.0 shifted the internet from a "read-only" resource to a "read-write" social ecosystem. However, social networks are more than just software; they are human connections. The authors noticed a gap in understanding how localized populations in Southern Brazil navigate the vast array of available tools—from microblogs to virtual worlds. The core motivation was to move beyond simply identifying what platforms are used and instead understand the intensity (frequency and duration) of that use.
Methodology: A Multi-Dimensional Framework
The researchers categorized the social web into 14 distinct types of tools, including:
- Publications: Blogs and Wikis (e.g., Wikipedia).
- Communication: Instant messaging (e.g., WhatsApp).
- Social Networking: Profile-centric platforms (e.g., Facebook, LinkedIn).
- Multimedia Sharing: Image (Instagram) and Video (YouTube).
- Niche Platforms: Lifestreaming, Livecast, MMOs, and Social Games.
They utilized a 5-point Likert scale to measure frequency and used Pearson’s Correlation to see if certain types of platforms naturally lead to "doomscrolling" or extended engagement.
Note: The study utilized a quantitative survey model to categorize user interactions across 14 digital genres.
Key Findings: The Reign of Facebook and WhatsApp
The data analysis revealed a clear hierarchy of digital attention:
- Platform Dominance: Facebook is nearly universal, cited by 91.6% of the sample. WhatsApp follows closely as a primary communication tool for 43.5%.
- The "Visual" Time-Sink: Interestingly, Image Sharing (Instagram) showed the strongest correlation with long-duration usage (r=0.322). This suggests that visual media is more effective at retaining user attention than purely text-based or audio-based content.
- Place of Access: Contrary to the "mobile-first" narrative of 2014-2016, 50.8% of respondents primarily accessed these networks at home. This indicates that social media serves as a primary leisure activity in the domestic sphere.
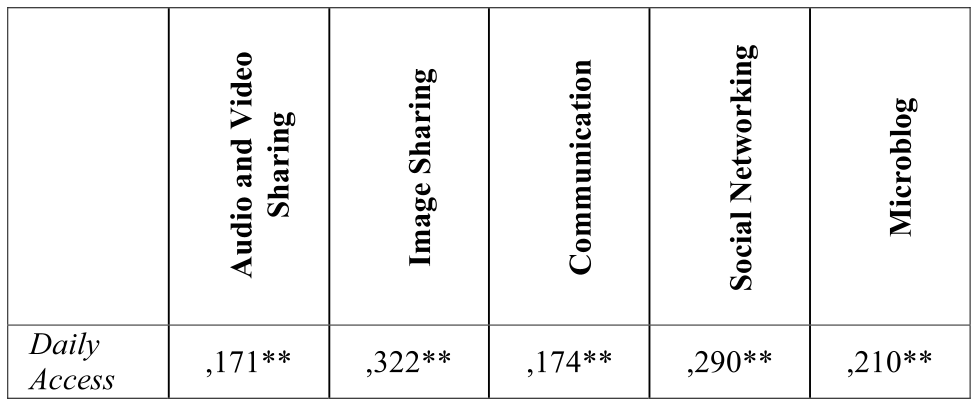 Table: Pearson’s Correlation showing the link between platform types and daily access time.
Critical Analysis & Future Outlook
While the study provides a robust baseline, it reflects a specific moment in time (data collected in 2014). The lack of dominance in MMOs or Virtual Worlds in the results may be due to the demographic skew (predominantly female, graduate-level education) rather than a lack of availability.
Takeaway
For marketers and researchers, the "Home" remains a critical battlefield for attention. The high correlation between Image Sharing and time spent confirms that the "Visual Turn" in social media (which eventually led to the rise of TikTok) was already deeply embedded in user behavior years ago.
Limitations & Future Work
- Demographic Bias: The sample was 65.5% female and highly educated (43.5% Graduate level), which may not represent the broader Brazilian population.
- Evolution of Mobility: Future research should investigate if "home access" has shifted to "everywhere access" as data plans in Brazil became more affordable post-2016.
- New Contenders: A follow-up study including TikTok and Discord would likely change the intensity levels of the "Video Sharing" and "MMO" categories.