
Interactive 3D Social Graphs: Breaking the Isolation of E-Learning
An Interactive 3D Social Graphs for Social Learning
The paper introduces an integrated E-learning environment hosted on Facebook that features an Interactive 3D Social Graph. It combines social network functionalities with a recommendation system and Kinect-based 3D visualization to transform traditional isolated online learning into a collaborative, gesture-controlled social experience.
TL;DR
This research tackles the "loneliness" of online education by embedding an E-learning platform directly into Facebook. By leveraging a Mutual Information-based recommendation system and a gesture-controlled 3D Social Graph, the authors transform abstract learning data into an interactive, spatial experience where students can "see" their friends' progress and collaborate in real-time.
Perspective: From Teaching Assistant to Social Hub
Most E-learning platforms are glorified digital filing cabinets. They host PDFs and videos but fail to replicate the organic "hallway conversations" or study groups found in physical schools. The authors argue that Social Learning—the process of learning through social interaction—is the most natural human way to acquire knowledge. To bridge this gap, they move learning to where the social action is: Facebook.
Methodology: The Architecture of Social Learning
The system architecture is a three-tiered bridge between social data and educational goals:
1. Facebook Integration
By using the Facebook API, the system eliminates the friction of creating new accounts. It utilizes the "Social Context"—using Likes and Comments as triggers for educational discussion. If a student finds a course interesting, it is broadcasted to their wall, inviting peer interaction.
2. The Recommendation Engine
The core of the "Who should I study with?" problem is solved using Mutual Information. The system calculates the entropy and joint distribution between users to find "learning twins."
- Friend Recommendation: Suggests new peers based on learning domain similarity.
- Course Recommendation: Uses Association Rules and a "Friend Weight Value" to suggest courses that your close friends are already excelling in.
3. Interactive 3D Visualization
Unlike 2D lists, the Interactive 3D Social Graph uses a 3D space to represent proximity.
- Spring-Embedding Algorithm: Nodes (students/courses) are treated like physical objects connected by springs, naturally forming clusters of similar interests.
- Kinetic Interaction: Using Microsoft Kinect, students can pan, zoom, and rotate their social network using hand gestures, making the exploration of "who knows what" feel like navigating a physical space.
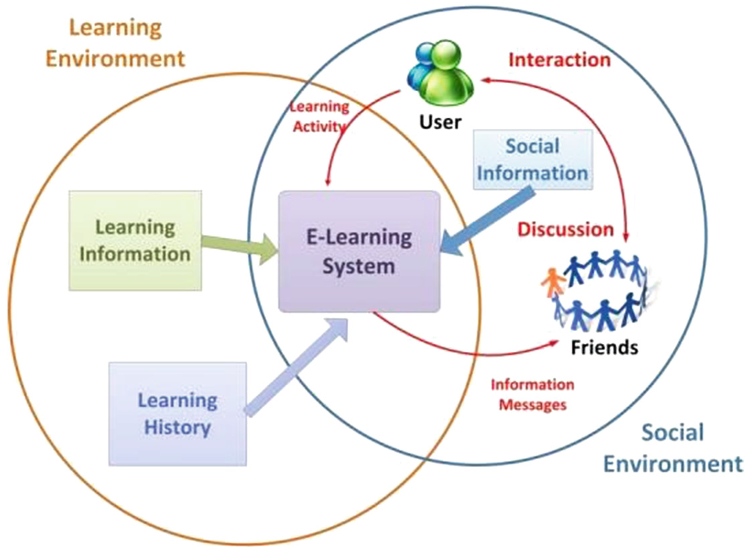 Figure 1: The overarching architecture integrating the E-learning hub with social media APIs and 3D visualization engines.
Experiments & Visual Results
The researchers demonstrated that nodes in the 3D graph could be visually distinguished by shape and color:
- Blue Spheres: The current user.
- Green Spheres/Stars: Different levels of friends (Acquaintances vs. Best Friends).
- Spatial Proximity: The closer two nodes are in the 3D space, the more similar their learning history.
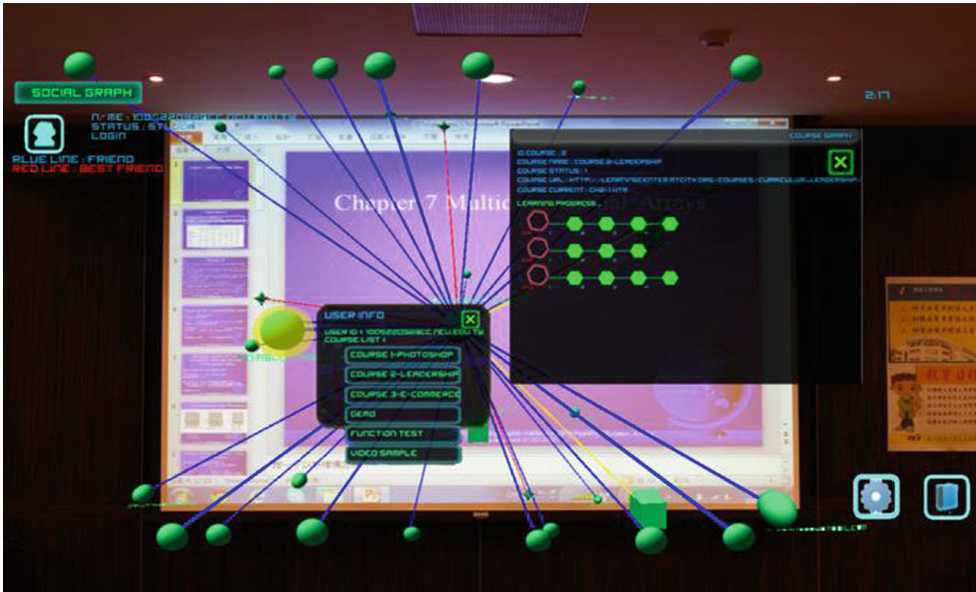 Figure 2: The Social Graph in action, showing the user (center) and their network based on learning similarity.
One of the most innovative features is the Focus Operation. When a user types a keyword (e.g., "Physics"), the graph dynamically filters and re-arranges itself to bring relevant experts in their friend group to the foreground.
Critical Insight & Future Outlook
While the integration with Facebook facilitates adoption, it raises significant privacy questions that the paper briefly overlooks. However, the technical achievement here is the gamification of social metadata. By turning learning progress into a spatial map, the system taps into human spatial memory and social curiosity.
Takeaway for the Industry: The future of E-learning isn't more content—it's more Context. Visualizing how we are connected to our peers through the knowledge we share makes the learning process not just an academic task, but a social journey.
Limitations
- Hardware Dependency: Kinect was innovative for its time but is now a legacy technology; moving to VR/AR (Apple Vision Pro/Quest 3) would be the modern evolution.
- Platform Lock-in: Relying solely on Facebook’s API makes the system vulnerable to platform policy changes (as seen in recent years regarding data privacy).
Summary for the Senior Academic Editor: This paper bridges Distributed Constructionism with modern Web technologies, providing a clear roadmap for more immersive EdTech solutions.