
Democratizing ML: Outperforming Black-Boxes with Interactive Visual Logic
Interactive Visual Self-service Data Classification Approach to Democratize Machine Learning
This paper introduces the Iterative Logical Classifier (ILC) algorithm integrated with Shifted Paired Coordinates (SPC) for self-service machine learning. It provides a lossless 2-D visualization of n-D data to enable domain experts to discover interpretable classification rules that outperform traditional black-box models on benchmark datasets like WBC, Iris, and Seeds.
TL;DR
Despite the dominance of Deep Learning, "Black-Box" models remain a major hurdle for domain experts in sensitive fields. This paper presents a breakthrough approach: the Iterative Logical Classifier (ILC). By leveraging a unique visualization technique called Shifted Paired Coordinates (SPC), the authors enable users to "see" n-dimensional data and manually/semi-automatically derive classification rules. The results? They didn't just match black-box accuracy; they beat it—achieving 100% accuracy on classic benchmarks while remaining entirely interpretable.
The Motivation: Interpretation as a Necessity, Not a Luxury
In medical diagnostics, such as breast cancer detection, a "trust me" from an algorithm isn't enough. Current AutoML solutions focus on hyperparameter tuning for complex models (like SVMs or Neural Networks) that no human can inspect.
The authors argue for Democratized Machine Learning. Their insight is simple: if we can represent high-dimensional (n-D) data in an intuitive 2-D format without losing any information, domain experts can use their natural pattern recognition abilities to define "Logical Rules" that are both more accurate and infinitely more explainable.
Methodology: The Power of Shifted Paired Coordinates (SPC)
The core of the system is SPCVis, an interactive software that transforms n-D points into a series of shifted pairs in 2-D space.
1. The Visualization Engine
Unlike traditional PCA or t-SNE, which contract data and lose original feature meaning, SPC is a lossless transformation. It allows users to:
- Perform Non-linear Scaling to enhance discrimination in crowded areas.
- Reorder dimensions to find the best "vertical separation" between classes.
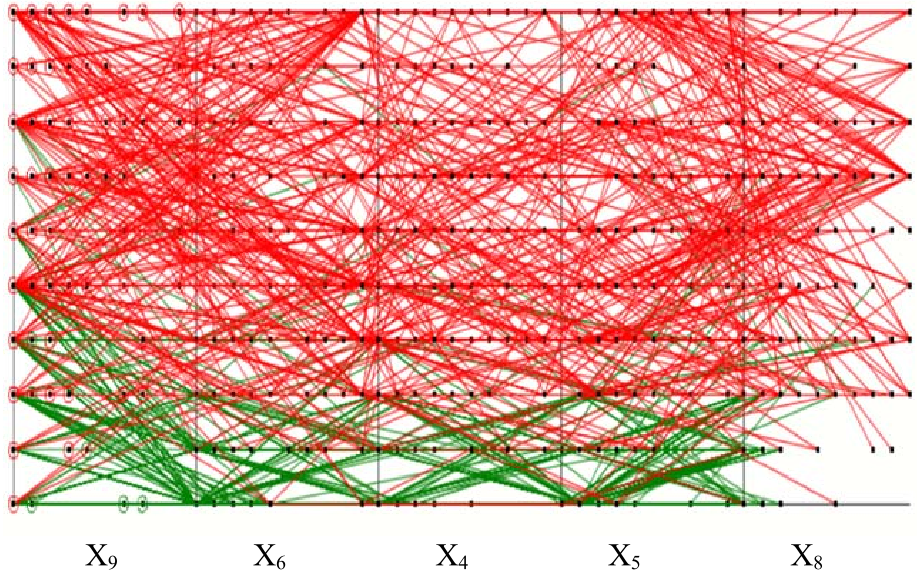 Fig. 1: The 9-D WBC dataset visualized in SPC. Green=Benign, Red=Malignant.
2. The Iterative Logical Classifier (ILC)
The classification isn't done in one giant leap. It’s an iterative "sieve":
- Extract Thresholds: User identifies clear gaps in the SPC graph.
- Generate Rules: Formulate logical statements (e.g., If X1 < 0.4 and X4 < 0.4, then Class 1).
- Iteration: The classified points are removed; the remaining "hard" points are visualized again with different coordinate shifts to find new patterns.
Experiments: Beating the SOTA
The study tested ILC against three gold-standard datasets: Iris (4-D), Wisconsin Breast Cancer (9-D), and Seeds (7-D).
The results were remarkable. On the WBC dataset, which often sees SVMs trailing at around 97%, the ILC achieved 99.56%. On the Iris and Seeds datasets, it reached a perfect 100%.
| Algorithm | WBC (9-D) | Iris (4-D) | Seeds (7-D) |
|---|---|---|---|
| Iterative Logical Classifier | 99.56% | 100% | 100% |
| SVM / k-NN | 96-97% | 98.6% | 95.7% |
| Neural Networks | N/A | 96.6% | 100% |
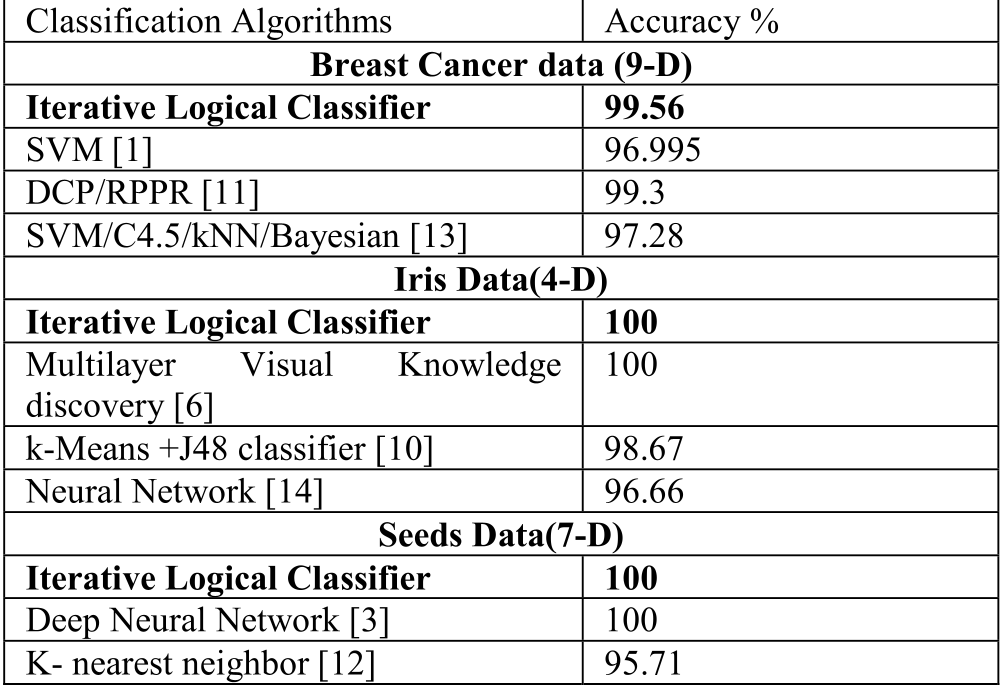 Fig. 2: Performance comparison showing ILC outperforming traditional ML models.
Deep Insight: Why Does This Work?
The success of ILC lies in its Inductive Bias. While a Neural Network tries to approximate a high-dimensional manifold through millions of weights, the ILC focuses on Interpretable Dominance Rectangles. By allowing a human to refine the "Pure" (single class) and "Mix" (overlapping class) regions, the model avoids the overgeneralization common in automated systems.
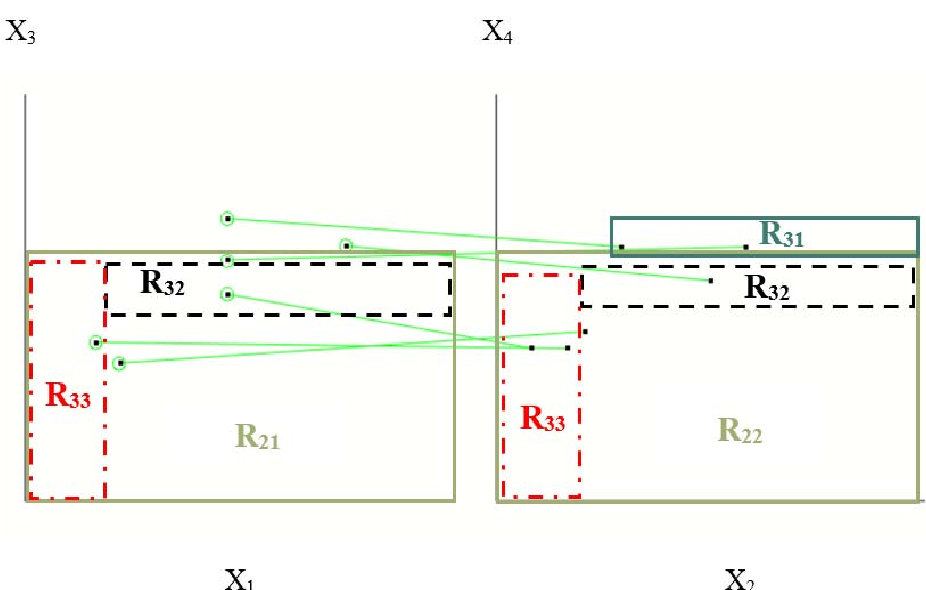 Fig. 3: Refined dominance rules for the Iris dataset, showcasing how users narrow down specific class regions.
Critical Analysis & Conclusion
The Takeaway: This paper proves that "Self-service ML" isn't a compromise—it's a competitive advantage. By putting the expert back in the loop with the right visual tools, we get models that are both more accurate and fully auditable.
Limitations:
- Scalability: While 9-D and 7-D are handled well, scaling to 1000-D features (like raw image pixels) would require automated feature selection or hierarchical SPC.
- Manual Effort: The current implementation relies heavily on user observation, though the authors mention future work will focus on increasing automation.
Looking Forward: The intersection of General Line Coordinates and automated rule-discovery could lead to a new generation of "Glass-Box" AI where the machine suggests the plot and the human confirms the logic.